

Insights & News
Seize today’s opportunities and stay ahead of what’s next with a spectrum of informative, thought-provoking and actionable insights.
Flash Report: 2Q26 U.S. Logistics Real Estate Market Snapshot

Featured
Flash Report: 2Q26 U.S. Logistics Real Estate Market Snapshot
Published on
Supply Chain 3.0: New Strides in Risk Readiness
 Supply Chain
Supply Chain 3.0: New Strides in Risk Readiness
Published on
The Future of Supply Chain Resilience: Key Insights from Manifest 2025
Operations
The Future of Supply Chain Resilience: Key Insights from Manifest 2025
Published on
Labor Challenges: Strategies for Warehouse Labor Planning
Workforce
Labor Challenges: Strategies for Warehouse Labor Planning
Published on
The Future of E-commerce Logistics: Insights from Marv Cunningham on Warehouse Automation and Sustainability
Operations
The Future of E-commerce Logistics: Insights from Marv Cunningham on Warehouse Automation and Sustainability
Published on
Incentives and Benefits: Enabling Clean Energy at Scale

Energy + Sustainability
Incentives and Benefits: Enabling Clean Energy at Scale
Published on
Five Key Strategies to Optimize Your Warehouse Operations
Operations
Five Key Strategies to Optimize Your Warehouse Operations
Published on
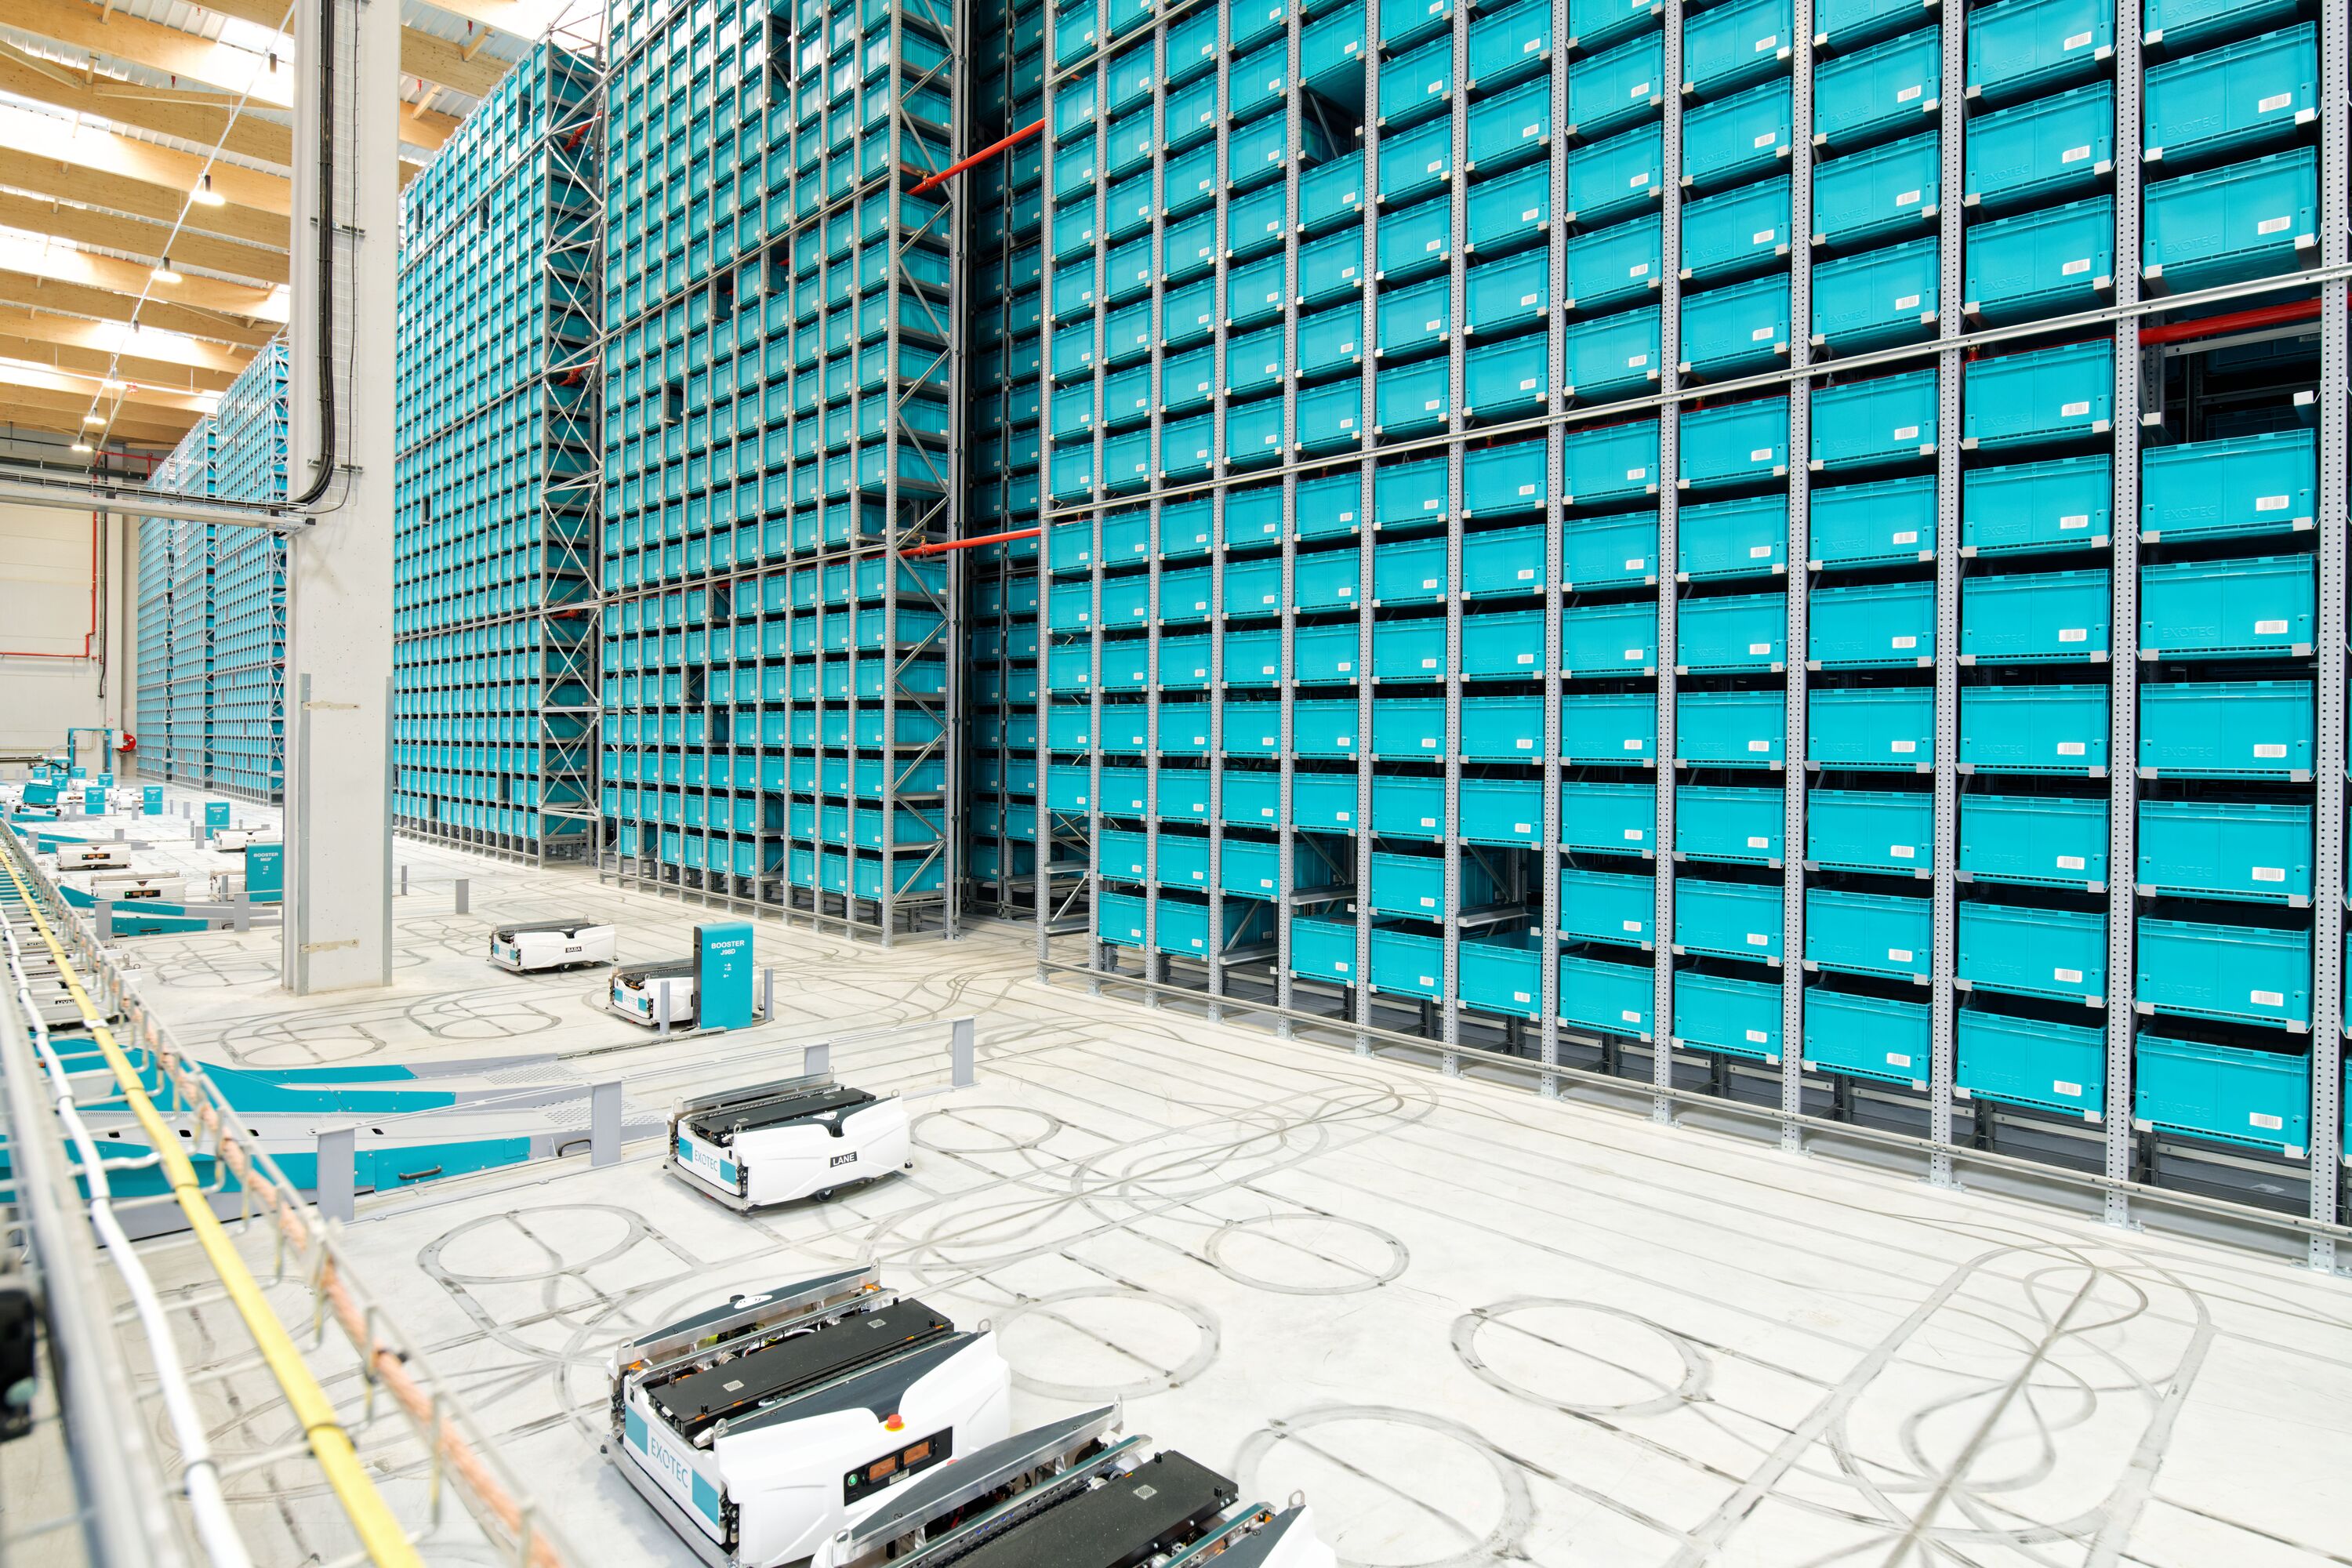
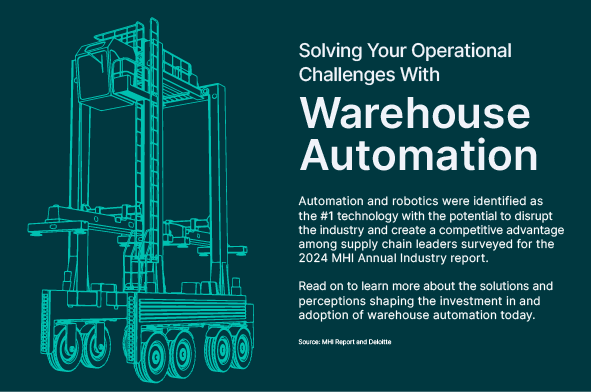
Solving Your Operational Challenges With Warehouse Automation
Operations
Solving Your Operational Challenges With Warehouse Automation
Published on

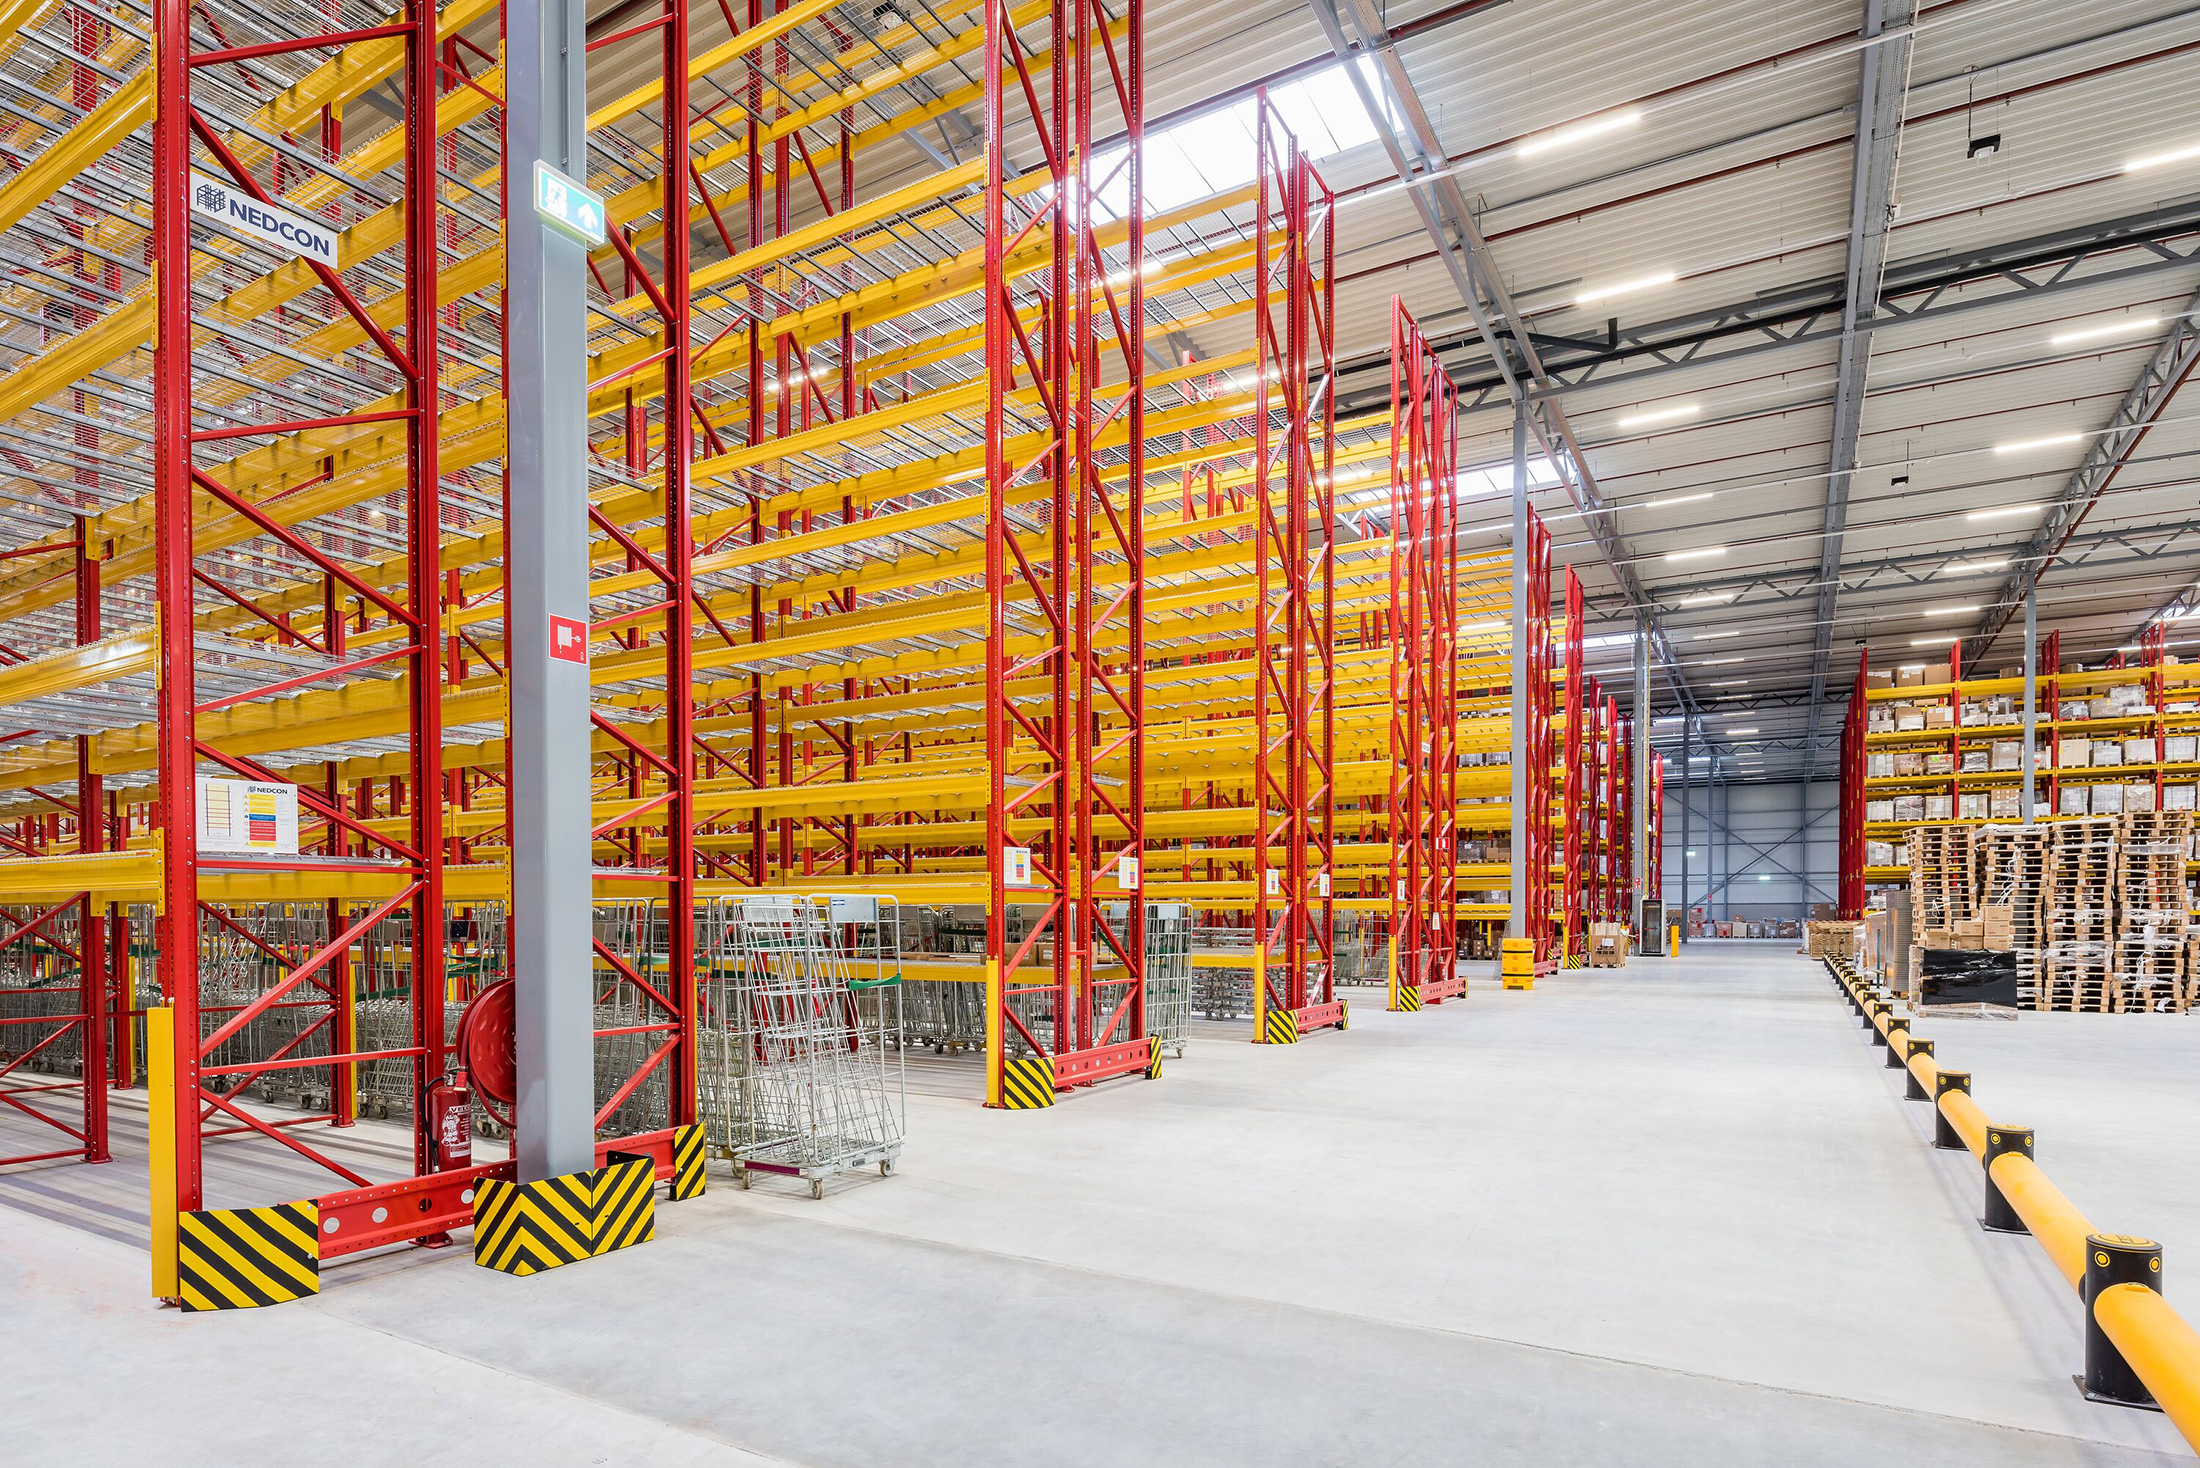
Upgrade Your Warehouse Operations with Integrated Design
Operations
Upgrade Your Warehouse Operations with Integrated Design
Published on
Future Proofing the Global Supply Chain: How AI, Automation and Other Technologies Are Impacting Efficiency
Supply Chain
Future Proofing the Global Supply Chain: How AI, Automation and Other Technologies Are Impacting Efficiency
Published on
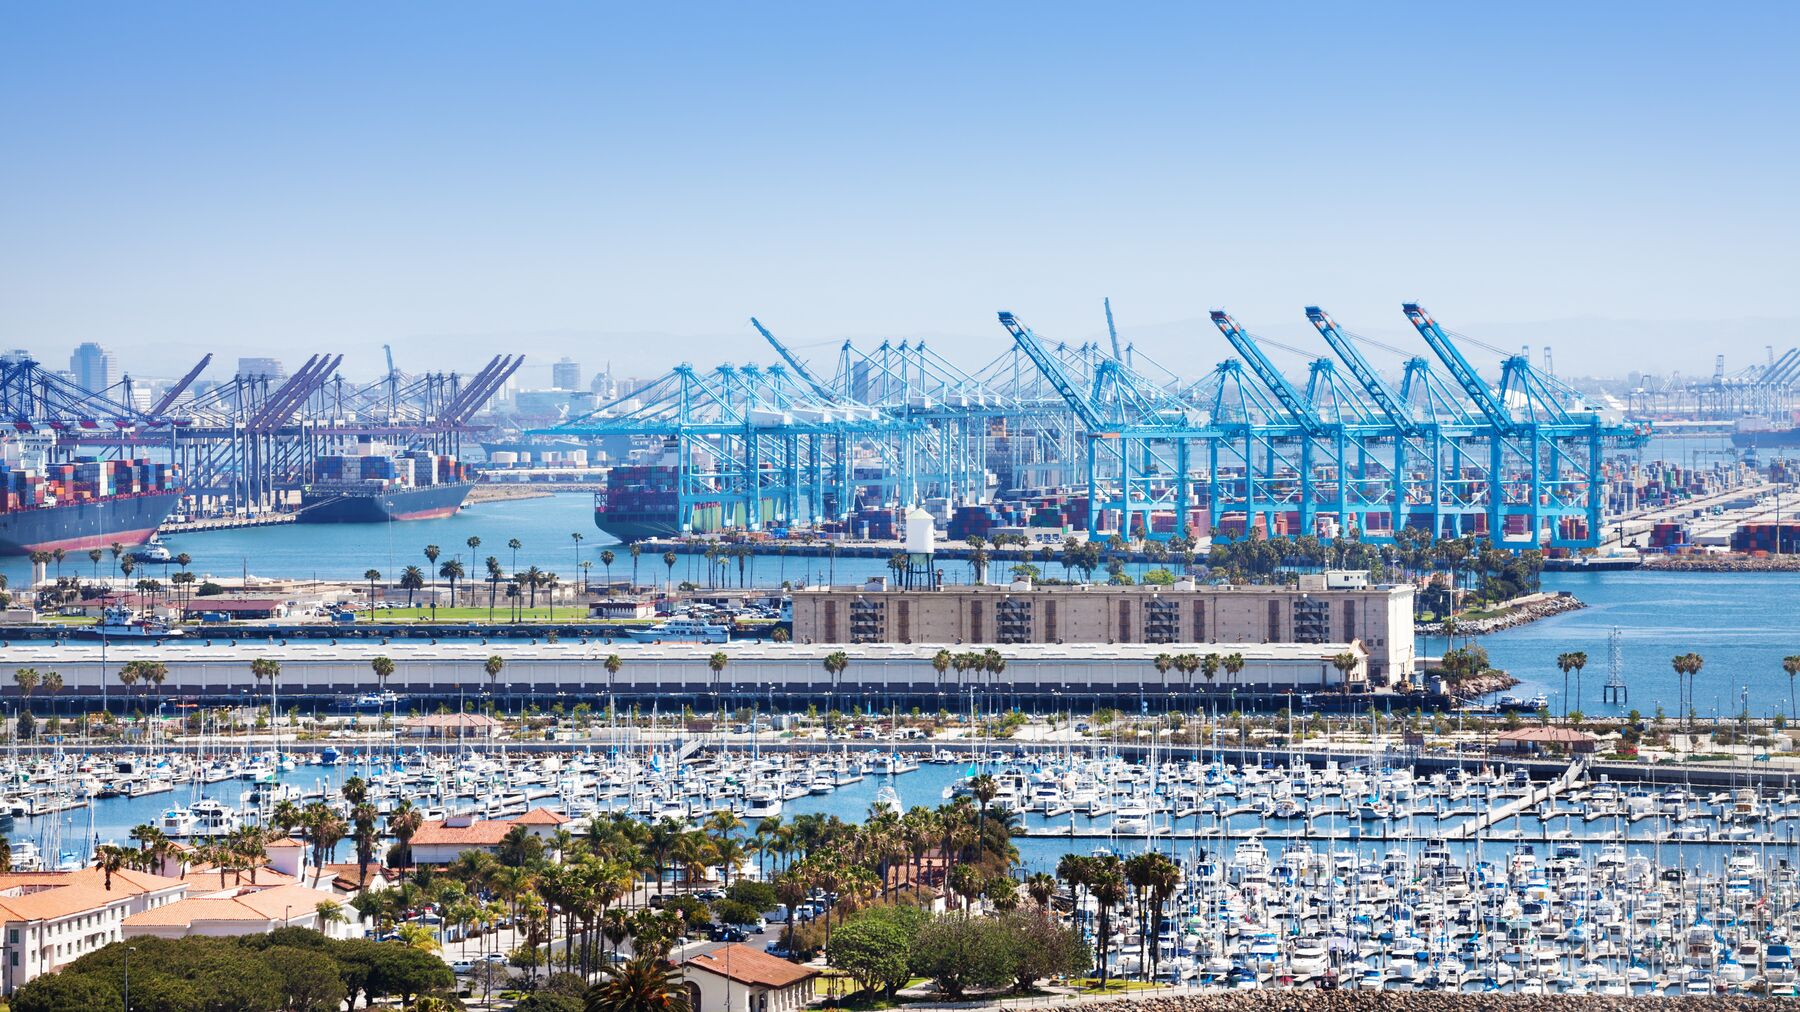
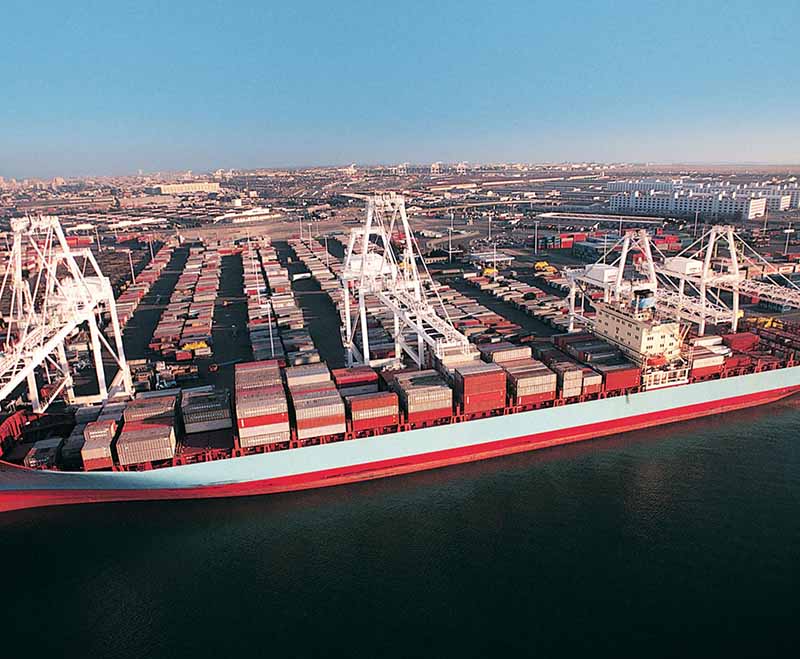
Port Disruption and the Flow of Goods Through Southern California
 Market Environment
Port Disruption and the Flow of Goods Through Southern California
Published on
Logistics Real Estate and E-commerce Lower the Carbon Footprint of Retail
 Market Environment
Logistics Real Estate and E-commerce Lower the Carbon Footprint of Retail
Published on
Automation and Logistics Real Estate #1: The State of Automation in Supply Chains
 Industry Innovation
Automation and Logistics Real Estate #1: The State of Automation in Supply Chains
Published on
COVID-19 Special Report #4: Customer Resilience Amid High Economic Volatility
 Market Environment
COVID-19 Special Report #4: Customer Resilience Amid High Economic Volatility
Published on
COVID-19 Special Report #2: Five Themes Shaping Logistics Real Estate
 Market Environment
COVID-19 Special Report #2: Five Themes Shaping Logistics Real Estate
Published on
The Evolution of the Modern Supply Chain and Implications for Logistics Real Estate Performance
 Supply Chain
The Evolution of the Modern Supply Chain and Implications for Logistics Real Estate Performance
Published on
Strong Rental Growth Continues Amid Historically Low Vacancies
 Logistics Rent Index
Strong Rental Growth Continues Amid Historically Low Vacancies
Published on
-
Load more
Flash Report: 2Q26 U.S. Logistics Real Estate Market Snapshot
Featured
Flash Report: 2Q26 U.S. Logistics Real Estate Market Snapshot
Published on
OnPrem Power: How Onsite Energy is Rewriting the Rules of Growth

Energy + Sustainability
OnPrem Power: How Onsite Energy is Rewriting the Rules of Growth
Published on
Prologis Ventures: 10 Years Investing Ahead of What’s Next in Logistics Innovation
 Industry Innovation
Prologis Ventures: 10 Years Investing Ahead of What’s Next in Logistics Innovation
Published on
Prologis Reports Second Quarter 2026 Results

Corporate News
Prologis Reports Second Quarter 2026 Results
Published on
Prologis Appoints Alfred F. Kelly, Jr. to Board of Directors

Corporate News
Prologis Appoints Alfred F. Kelly, Jr. to Board of Directors
Published on
A Warehouse Redesign That Unlocked 11,000 Additional Pallet Positions

Operations
A Warehouse Redesign That Unlocked 11,000 Additional Pallet Positions
Published on
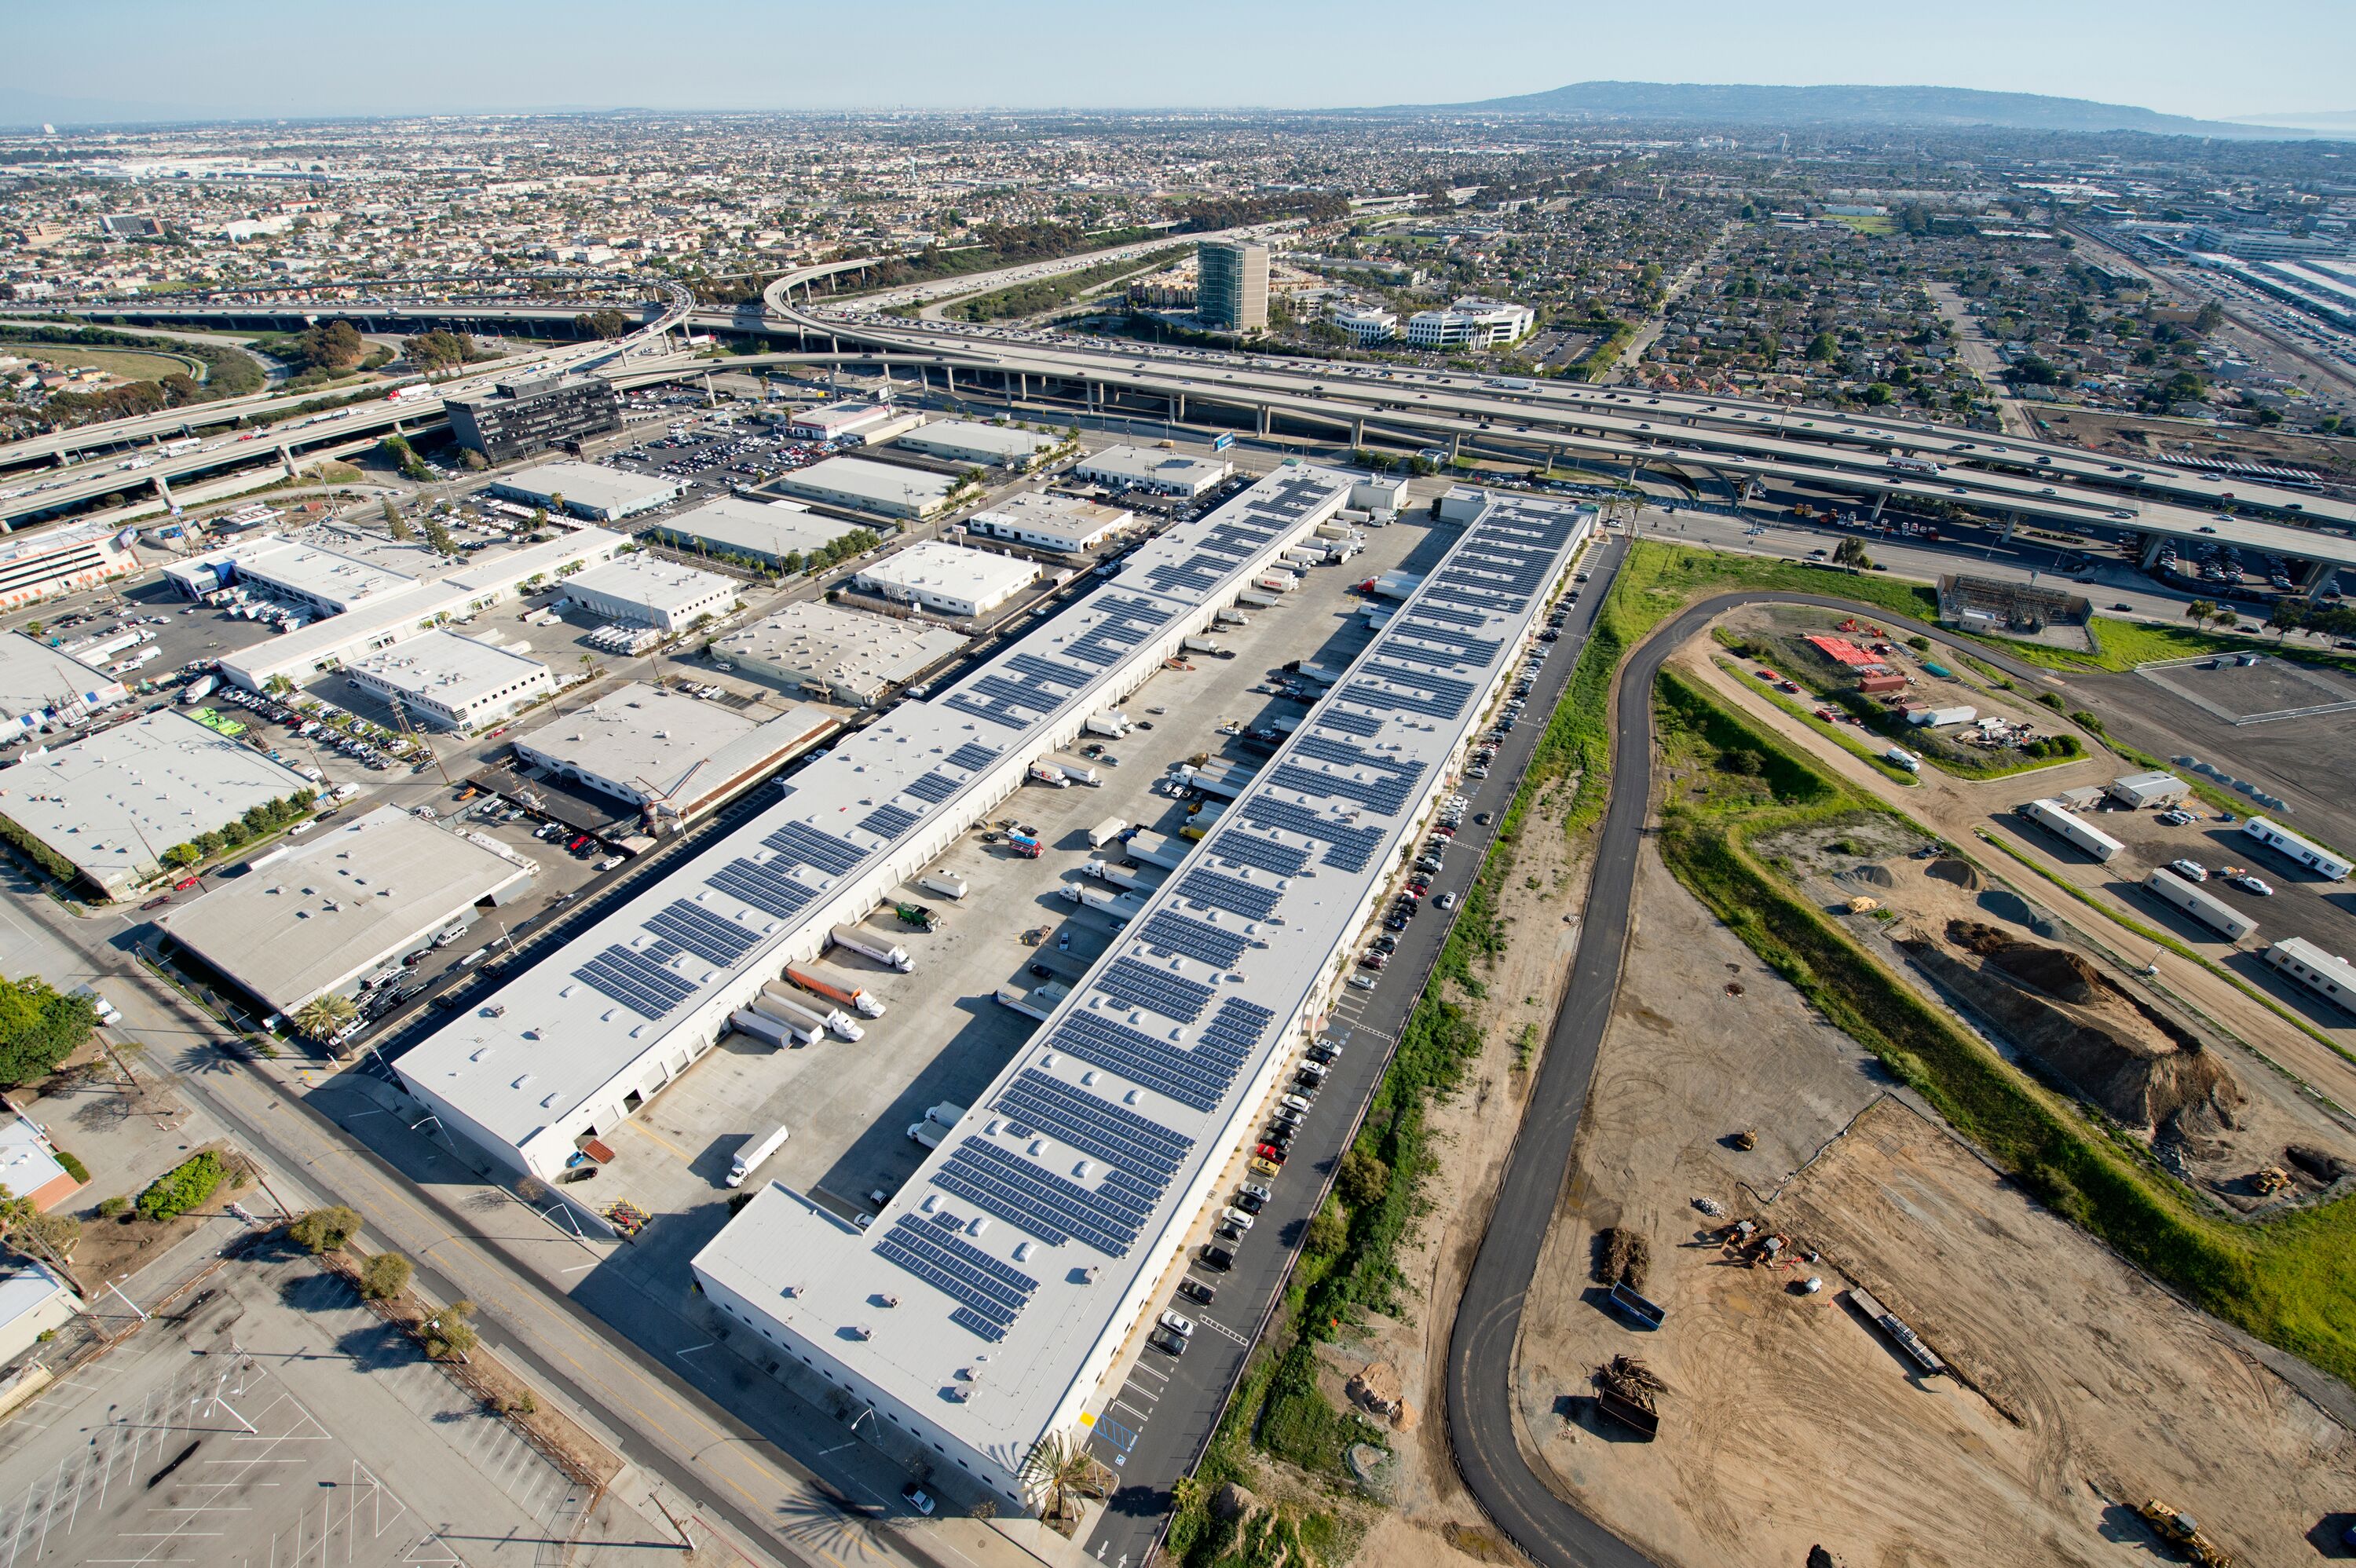
How Prologis Warehouse Rooftops Are Powering Community Solar in California
 Energy + Sustainability
How Prologis Warehouse Rooftops Are Powering Community Solar in California
Published on