AMB Property Corporation
AMB's industrial assets, located predominantly in infill submarkets of major hub and gateway distribution markets, were 94.4% leased as of September 30, 2002, unchanged from June 30, 2002. The Company's same store cash basis net operating income increased 0.2% for the quarter. Year-to-date tenant retention was 73.7%, while rents on renewals and rollovers increased by a modest 0.1% as the Company continued to focus on occupancy. Year-to-date same store cash basis net operating income increased 1.1%.
"AMB's quarterly and year-to-date results are consistent with our expectations in a difficult operating environment. We believe the industrial market is in the early stages of a slow recovery. We are seeing evidence of increasing cargo volumes and a modest up-tick in leasing activity -- signs we believe will lead to positive absorption in time. Historically, positive absorption and constrained new supply lead to growth in occupancy and, subsequently, to growth in rents. However, it will take time for the recovery, which is slower than we originally envisioned, to positively impact our results," noted Chairman and CEO, Hamid R. Moghadam.
Investment Activity
During the third quarter, AMB acquired eight industrial facilities for a total investment of $89.2 million and disposed of six properties for a cumulative price of $33.6 million. During the quarter, AMB completed and stabilized five industrial development projects, totaling 937,000 square feet for a total investment of $50.4 million. The industrial development and renovation pipeline currently stands at $128.1 million and consists of 2.9 million square feet, of which $98.6 million, or 77.0%, has been funded and 53% is preleased.
The Company significantly advanced its on-tarmac strategy in the quarter with the acquisition of two on-tarmac cargo facilities at John F. Kennedy International Airport. The buildings combined have more than 426,500 rentable square feet, 61 truck doors with immediate ramp access and two parking spots for wide body planes. The acquisition brings AMB's on-tarmac presence to 12 domestic airports; on-tarmac real estate now accounts for over 7% of the Company's annualized base rents.
AMB's President, W. Blake Baird, summarized, "In our view, the domestic transaction environment for industrial real estate increasingly favors sellers over buyers. As a result, we plan to accelerate our dispositions of non- strategic assets and more quickly reduce our presence in non-target markets in the U.S. We now expect to exceed our previously announced disposition guidance, including net contributions to joint ventures, of $200 million for 2002. Our anticipated disposition activity, combined with more modest acquisition volumes, should result in net real estate sales over the next several quarters. The ensuing liquidity will dilute our short-term results but should contribute to stronger long-term results once deployed into either more strategic industrial assets or share repurchases."
Furthering the Company's international expansion plan, AMB has formed a strategic alliance with Boustead Projects, the real estate development subsidiary of the multi-national Boustead Singapore Ltd., that will initially focus on distribution facilities in the eastern Singapore submarket of Changi Airport and in Jurong, the industrial heart of Singapore. Further, AMB is aligning with SIRIUS L'Immobilier D'Enterprise, one of the largest owners of airport-adjacent industrial buildings at France's Charles de Gaulle Roissy International Airport (CDG), to focus on projects at or near CDG airport.
Mr. Moghadam commented, "Our operating model is based on partnering with the best local entrepreneurs in each market. Combining our customer relationships and investment expertise with our partners' local operating expertise, we expect to meet our customers' needs and provide solid returns to our investors. Singapore and Paris are both integral links in the global supply chain and we are delighted to be forming strategic alliances with Boustead and SIRIUS. We expect to announce additional alliances in other international target markets in future quarters."
Mr. Baird added, "Our international expansion is proceeding with significant traction. As we said in January this year, we are seeking investment opportunities in three Mexican distribution markets and eight large international airport markets. The first phase of our previously announced Mexico City development project with Strategic Alliance Partner(R) G. Accion was delivered in September to the customer on time and on budget. We hope to announce additional capital deployment in Mexico over the next few quarters. Dialogue with our global customers indicates strong interest in our target locations; we are currently working on potential development opportunities adjacent to Changi Airport in Singapore and potential acquisition and development opportunities near Charles de Gaulle in Paris with our respective alliance partners."
Other investment activity in the quarter included the repurchase of $11.4 million of the Company's common stock and $7.1 million of preferred units. In total, 433,200 shares of common stock were purchased at an average price of $26.41 per share under the Company's current share repurchase plan, leaving $88.6 million of common stock repurchase capacity under the plan. AMB's preferred unit repurchases included 130,000 of its Series F units and all of its outstanding Series G units.
Supplemental Reporting Measure
AMB reported third quarter 2002 Funds from Operations (FFO) of $0.58 per share, representing a 7.9% decrease over third quarter 2001 FFO of $0.63 per share. Year-to-date FFO per share was $1.79, up 9.1% from the same period in 2001 of $1.64. Both the current quarter and third quarter 2001 include $0.01 per share of gains on developments held for sale projects; 2001 year-to-date FFO included a $0.23 write-off of the Company's investments in technology related companies.
Conference Call
AMB will host a conference call to discuss its third quarter 2002 results Tuesday, October 8, 2002 at 11:00 AM PDT/ 2:00 PM EDT. Stockholders and interested parties may listen to a live broadcast of the call by dialing (719) 457-2727 and using reservation code 392057. The conference call can also be accessed through the Internet on AMB's website at www.amb.com; please visit the website at least fifteen minutes early to register, download and install any necessary audio software. For those who are not able to listen to the live broadcast, replays will be available shortly after the call until October 29, 2002 via telephone by dialing 719-457-0820 with reservation code 392057 and until October 29, 2002 on the Company's website.
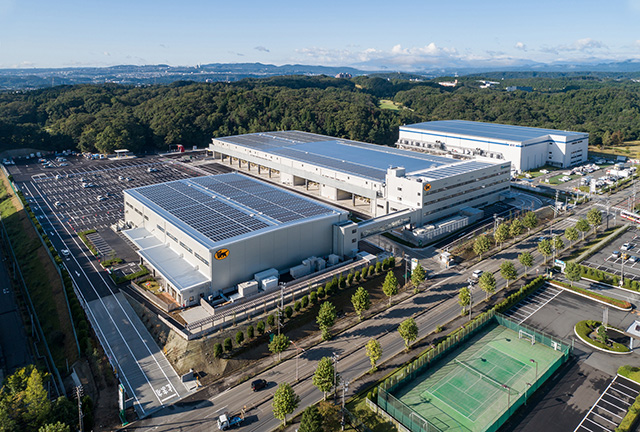
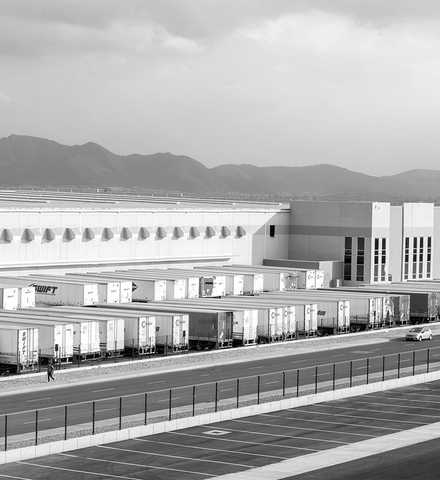
AMB Property Corporation is a leading owner and operator of industrial real estate in North America. As of September 30, 2002 AMB owned, managed and had renovation and development projects totaling 97.2 million square feet (9.0 million square meters) and 1,032 buildings in 27 markets. AMB invests in industrial properties located predominantly in infill submarkets of major hub and gateway distribution markets. The Company's portfolio is comprised largely of High Throughput Distribution(R) facilities - industrial properties built for speed and located near airports, seaports and ground transportation systems.
AMB's press releases are available on the Company website at http://www.amb.com/ or by contacting the Investor Relations department toll- free at 877-285-3111.
                       CONSOLIDATED BALANCE SHEETS
                          (dollars in thousands)


                                                 As of
                            September 30,  June 30,  March 31,  December 31,
                                2002         2002       2002        2001
  Assets
  Investments in real estate:
    Total investments in
     properties              $4,883,497  $4,732,321  $4,566,951  $4,530,711
    Accumulated depreciation   (344,949)   (311,058)   (289,701)   (265,653)
      Net investments in
       properties             4,538,548   4,421,263   4,277,250   4,265,058
    Investment in
     unconsolidated joint
     ventures                    64,822      64,083      71,137      71,097
    Properties held for
     divestiture, net           105,613     133,934     139,370     157,174
      Net investments in
       real estate            4,708,983   4,619,280   4,487,757   4,493,329
  Cash and cash equivalents      90,840     119,287      99,492      81,732
  Mortgage receivables           13,155      87,175      87,214      87,214
  Accounts receivable, net       81,003      80,366      75,399      70,794
  Other assets, including
   discontinued operations       48,608      39,390      39,392      35,874
       Total assets          $4,942,589  $4,945,498  $4,789,254  $4,768,943

  Liabilities and
   Stockholders' Equity
  Secured debt               $1,305,320  $1,360,436  $1,237,564  $1,228,214
  Unsecured senior debt
   securities                   800,000     800,000     800,000     780,000
  Unsecured debt                 10,319          --          --          --
  Unsecured credit facility      12,000          --          --      12,000
  Alliance Fund II credit
   facility                      72,500      52,000     116,000     123,500
  Other liabilities,
   including discontinued
   operations                   189,076     162,629     155,568     138,601
      Total liabilities       2,389,215   2,375,065   2,309,132   2,282,315
  Minority interests:
    Preferred units             308,388     315,847     275,987     275,987
    Minority interests          506,533     508,577     455,428     458,299
      Total minority
       interests                814,921     824,424     731,415     734,286
  Stockholders' equity:
    Common stock              1,642,459   1,649,909   1,652,607   1,656,242
    Preferred stock              95,994      96,100      96,100      96,100
      Total stockholders'
       equity                 1,738,453   1,746,009   1,748,707   1,752,342
       Total liabilities and
        stockholders' equity $4,942,589  $4,945,498  $4,789,254  $4,768,943


                  CONSOLIDATED STATEMENTS OF OPERATIONS
                          (dollars in thousands)


                                                      For the Nine Months
                              For the Quarters Ended          Ended
                                   September 30,           September 30,
                                 2002        2001        2002        2001
  Revenues
  Rental revenues              $158,283    $145,140    $459,505    $418,519
  Equity in earnings of
   unconsolidated joint
   ventures                       1,322       1,636       4,443       4,365
  Private capital income          2,766       2,340       8,468       8,022
  Interest and other income       2,609       5,392       9,921      12,505
    Total revenues              164,980     154,508     482,337     443,411
  Expenses
  Property operating             40,658      35,151     114,440     101,222
  Interest, including
   amortization                  38,661      32,842     112,044      94,314
  Depreciation and
   amortization                  33,749      28,835      95,186      82,758
  General administrative and
   other (1) (2)                 12,376       8,796      34,207      26,180
  Loss on investments in
   other companies                   --          --          --      20,758
    Total expenses              125,444     105,624     355,877     325,232
       Income before
        minority interests
        and gains                39,536      48,884     126,460     118,179
  Minority interests' share
   of income:
    Preferred units              (6,403)     (7,423)    (18,770)    (21,626)
    Minority interests          (10,863)    (10,556)    (29,498)    (26,324)
       Total minority
        interests               (17,266)    (17,979)    (48,268)    (47,950)
       Net income before
        discontinued
        operations, gains,
        and extraordinary
        items                    22,270      30,905      78,192      70,229
  Discontinued operations,
   gains, and extraordinary
   items:
    Discontinued operations         330         471       1,349       1,399
    Gains on developments
     held for sale                  618       1,341         618       1,341
    Gains/(losses) from
     disposition of real
     estate, net of minority
     interests (3)                3,944      (1,227)      6,424      33,332
    Extraordinary items             (88)         87        (356)       (351)
       Total discontinued
        operations, gains,
        and extraordinary
        items                     4,804         672       8,035      35,721
       Net income                27,074      31,577      86,227     105,950
  Preferred stock dividends      (2,123)     (2,125)     (6,373)     (6,375)
  Preferred unit redemption
   discount                         412          --         412          --
  Net income available to
   common stockholders          $25,363     $29,452     $80,266     $99,575

  Net income per common
   share (diluted)                $0.30       $0.34       $0.94       $1.17

  Weighted average common
   shares (diluted)          85,527,829  85,644,840  85,360,210  85,097,692

  (1) Includes share-based plans expense of $0.3 million and $0.7 million
      for the quarter and nine months ended September 30, 2002,
      respectively, related to the adoption of SFAS 123.
  (2) Prior to May 31, 2001, G&A did not include expenses incurred by two
      unconsolidated preferred stock subsidiaries, Headlands Realty
      Corporation and AMB Capital Partners. Adjusted G&A for the nine months
      ended September 30, 2001, would have been $29,713 had the subsidiaries
      been consolidated beginning January 1, 2001.
  (3) Includes unrealized losses on assets held for sale of $10.0 million
      for the quarter and nine months ended September 30, 2001.


             CONSOLIDATED STATEMENTS OF FUNDS FROM OPERATIONS
                (dollars in thousands, except share data)


                                                         For the Nine Months
                                For the Quarters Ended          Ended
                                    September 30,           September 30,
                                  2002        2001        2002        2001
  Income before minority
   interests and gains          $39,536     $48,884    $126,460    $118,179
  Gains on developments held
   for sale                         618       1,341         618       1,341
  Total depreciation and
   amortization                  33,749      28,835      95,186      82,758
  FF& E depreciation, ground
   lease amortization, and
   other (1)                       (815)       (483)     (1,742)     (1,456)
  Discontinued operations'
   FFO                              405         597       1,634       1,779
  FFO attributable to
   minority interests           (13,635)    (13,393)    (37,753)    (29,119)
  Adjustments to derive FFO
   from unconsolidated JVs:
    AMB's share of net income    (1,322)     (1,636)     (4,443)     (4,365)
    AMB's share of FFO            2,048       2,235       6,611       6,488
  Preferred stock dividends      (2,123)     (2,125)     (6,373)     (6,375)
  Preferred units
   distributions                 (6,403)     (7,423)    (18,770)    (21,626)
  Funds from operations         $52,058     $56,832    $161,428    $147,604

  FFO per common share and
   unit (diluted)                 $0.58       $0.63       $1.79       $1.64

  Weighted average common
   shares and units
   (diluted)                 90,379,023  90,799,887  90,239,149  90,263,046

  (1) Ground lease amortization represents the amortization of the Company's
      investments in ground leased properties, for which the Company does
      not have a purchase option.
SOURCE: AMB Property Corporation
CONTACT: Investors/Analysts, Michelle C. Wells, Investor Relations,
877-285-3111, or
+1-415-733-9478, or
+1-415-394-9001
Web site: http://www.amb.com/


