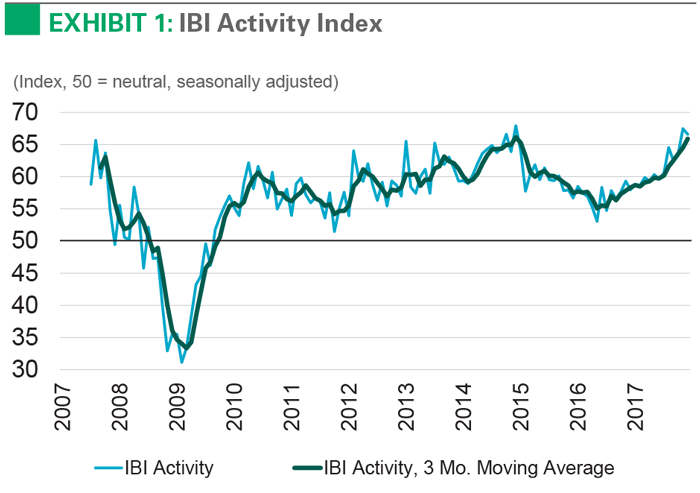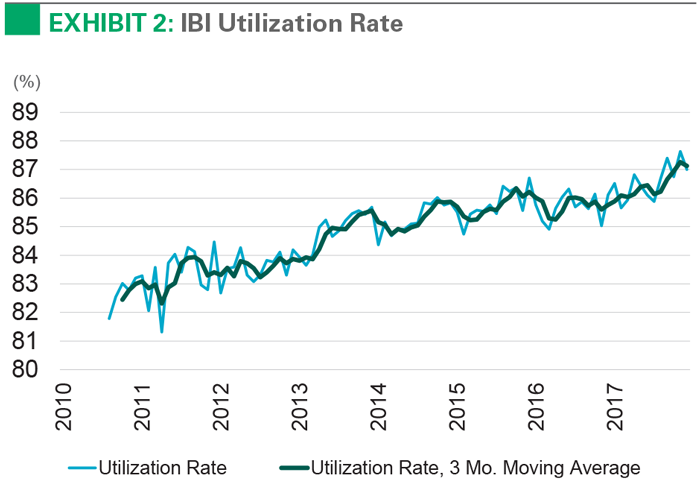
Users of logistics real estate reported strong growth in activity through the second half of 2017, according to Prologis’ proprietary customer survey, the Industrial Business Indicator (IBI)TM. The latest reading of customer activity in December came in at 66, in line with the past three months, holding the index at its highest level since 2014. Strengthening underlying demand drivers for customers, coupled with few available logistics facilities to accommodate expansion, drove the IBI utilization rate to an all-time peak of 87%.
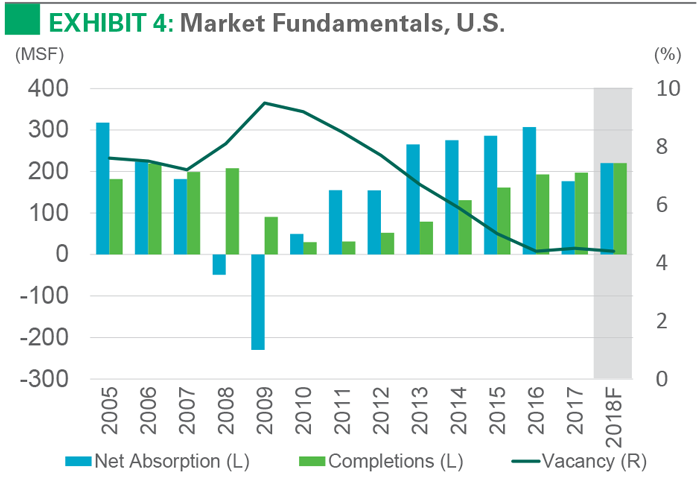
Leading indicators point to continued growth of logistics demand in 2018, expressed through strong absorption in markets with more new supply and strong rent growth in markets with few available options. Prologis Research expects that capacity constraints will cause demand and supply to move in tandem through the near term, keeping the vacancy rate near its historic low of 4.5%1 and putting further pressure on rents.
Increasing activity spans customer industries and geographies. Nationally, the IBI activity index has remained above 60 since July 2017, with readings above 50 signifying growth. From October to December 2017, the index has averaged 66, reflecting very strong growth (see Exhibit 1). This acceleration in growth has affected all customer industries, but customers that offer transportation services have seen particularly notable improvement. Each U.S. region also reported stronger growth in 2017 compared with 2016, with the fastest acceleration in the western U.S. Strong port in-flows and economic growth likely underscored this outperformance.2
Disciplined new supply is boosting utilization of existing real estate. While rapidly rising rental rates are attracting more new supply, the increase has been more gradual than many had anticipated. Development starts grew by 7% in 2017 after rising by double-digits in previous years.3 A lack of developable land and labor, coupled with regulatory barriers and rising replacement costs, has constrained new construction. As a result, annual deliveries are still well below the peak levels of previous cycles.4 With a lack of available options in which to grow, customers have had to maximize the productivity of their existing real estate footprints. This is why our customers’ utilization rate has reached record levels (see Exhibit 2).
The U.S. logistics real estate market is redefining the value of location. Seven consecutive years of demand in excess of supply have cut the vacancy rate in half, to an all-time low of 4.5% since data availability began.5 Rising service levels are prompting occupiers to build out their distribution capabilities closer to end consumers. Augmenting this trend, the continued shift of buying habits in favor of e-commerce is adding tailwinds to logistics demand.6 Increased information, rising structural barriers to new supply, and a more cautious approach to risk by developers and their capital partners is bringing more discipline to the supply side. The result: competition for limited available space is driving up rental rates.7
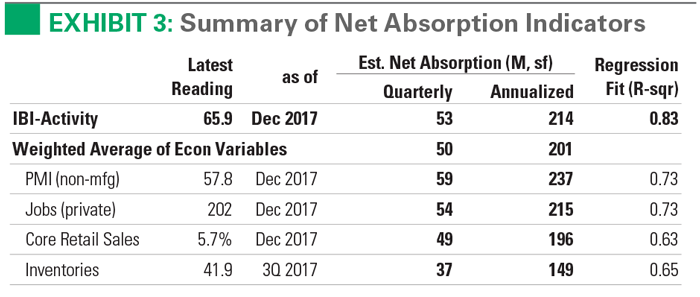
Low vacancy should extend into 2018. Strengthening demand drivers will likely be met with measured new supply. Prologis Research’s forecast calls for demand and supply to move in tandem, as customers absorb the space that becomes available (see Exhibits 3 and 4). With about 220 million square feet each of supply and demand, this state of forced equilibrium will keep the vacancy rate near its historic low point. Limited availabilities and rising replacement costs should put upward pressure on rental rates across U.S. markets. In short, we see continued challenges for logistics real estate customers. Planning ahead for growth requirements has never been more crucial.
Endnotes
2. Various port authorities, U.S. Bureau of Labor Statistics as of November 2017
3. Prologis
4. CBRE-EA data as of Q4 2017
5. CBRE-EA data as of Q4 2017
6. U.S. Census Bureau e-commerce release as of 3Q 2017
7. Prologis Research Rent Index as of 4Q 2017
