Download the audio version of this video
Overview
Today’s supply chains are undergoing a mission-critical evolution as service levels move to the forefront of businesses’ revenue generation potential. Enabled by technology, data and enhanced visibility into consumer needs, an increasingly competitive environment is driving urgency in supply chain reconfiguration. The new Prologis framework for categorizing properties by their location along the modern supply chain provides data on trends and, importantly, allows us to identify the future of supply chains and logistics real estate performance.
As supply chains continue to evolve, by nature they both drive and respond to conditions across the logistics real estate sector. In this second installment of our two-part Property Classification Special Report, we note the following key takeaways:
- The market is likely in the beginning stages of the current evolution, as structural supply chain shifts happen over multiple cycles, and can be measured through logistics real estate demand.
- The combination of supply and demand shifts determines long-term real estate performance. Supply chain shifts generate demand and, in the absence of supply constraints, increased supply. In areas with supply constraints, they instead produce rapid rent growth.
- Looking forward, the future direction of supply chains should produce logistics real estate outperformance in Last Touch®1 and City distribution properties, as well as highly-functional Gateway and Multi-market properties in areas with high barriers to new supply.
Supply chain shifts are reflected in relative demand growth rates
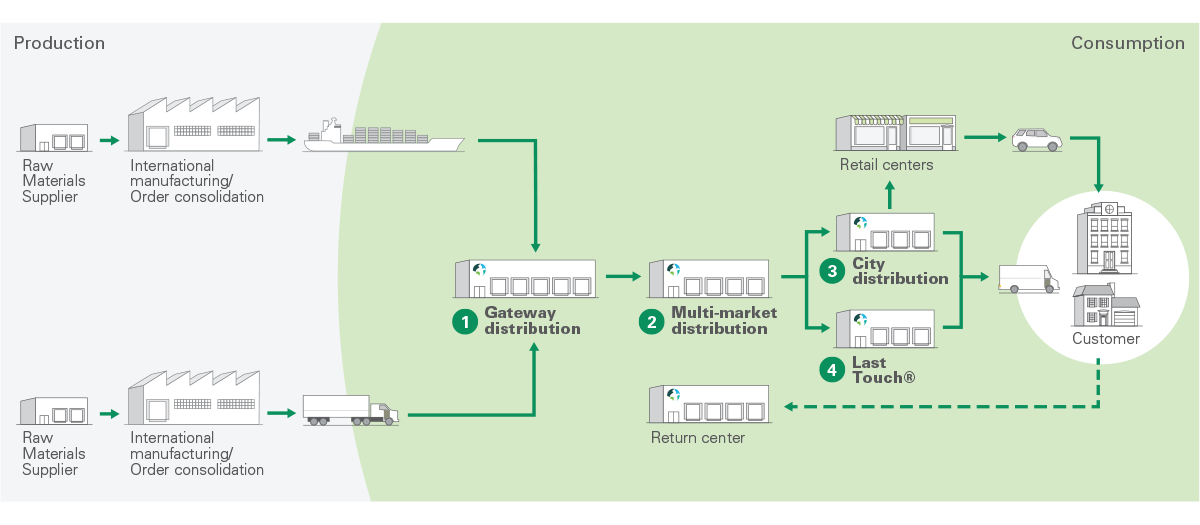
With supply chains, the only constant is change—and that change tends to be gradual. By segmenting logistics real estate properties into the four main categories of the consumption end of the modern supply chain—Gateway, Multi-market, City, and Last Touch® [see Exhibit 1]—we can study the impact of historical supply chain shifts on logistics real estate performance and take a stance on its future direction.
Exhibit 1
THE MODERN SUPPLY CHAIN
Gateway and Multi-market properties are positioned to access several markets within a one-day truck drive, and leverage both functionality and access to transportation routes in order to aid velocity through supply chains. Gateway properties have the added feature of being near a major sea or intermodal port. In Greater New York, Gateway facilities can access roughly $200 billion in income within one hour; that number falls to $50 billion for Multi-market. Yet Multi-market can reach nearly $3 trillion within a one-day truck drive with Gateway reaching $2.7 trillion.
City distribution properties are in urban areas of large consumption markets and they are well-positioned for next- or two-day shipping. In Greater New York, City properties can reach about $400 billion within one-hour at peak traffic. Last Touch properties are only in the densest areas of the largest consumption markets. As a result, the average amount of income reached within a one-hour radius is roughly 2-4x the other property categories. In Greater New York, this income reach for Last Touch translates to roughly $550 billion.
For most national users of logistics real estate today, complex supply chains require a built-out network comprising all four property categories. Yet, this dynamic has evolved over time. Looking back, globalization is reflected in logistics real estate demand over the last 25+ years2, while urbanization and rising service levels are driving recent industry trends.
Demand trends 1989 to 2007—Globalization of supply chains and Gateway logistics real estate
Gateway logistics properties are well-positioned for distribution to several metro areas within a one-day truck drive and they have access to a major sea or intermodal port within two hours at peak traffic.
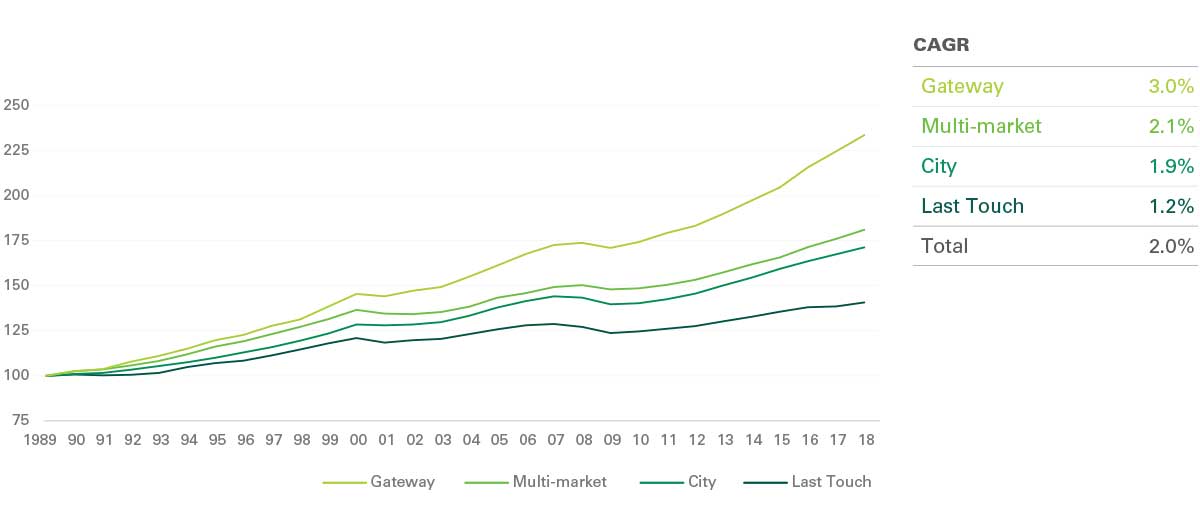
With more businesses having moved production overseas, demand for logistics real estate in these strategic locations had increased significantly. Using data from 1989 onward, the earliest available, Gateway demand growth outpaced any other property category [see Exhibit 2] through the past three cycles. From 1989 to 2018, the rate of growth in occupied space in Gateway properties grew by 3.0% per year, compared with roughly 2.0% growth in logistics real estate overall.3
However, the impact of globalization has not been confined to Gateway properties. The increased adoption of just-in-time inventory models and rapid labor force growth in secondary cities and suburban/exurban areas had further incentivized the lengthening of domestic supply chains, producing demand for Multi-market and City logistics real estate at transportation junctions throughout the country.
Exhibit 2
CHANGE IN OCCUPIED SPACE BY PROPERTY CATEGORY
Index, 1989 = 100
Demand trends 2010 to 2019—Urbanization, rising service levels and Last Touch/City logistics real estate
While the demand dynamics of the 1990s and 2000s reflected a shift away from population centers toward lower-cost logistics facilities along global trade routes, the most recent cycle indicates a desire to be close to the end consumers. Post-GFC, the combination of e-commerce and the urbanization of the U.S. labor force has prompted a renewed focus on proximity to consumers.
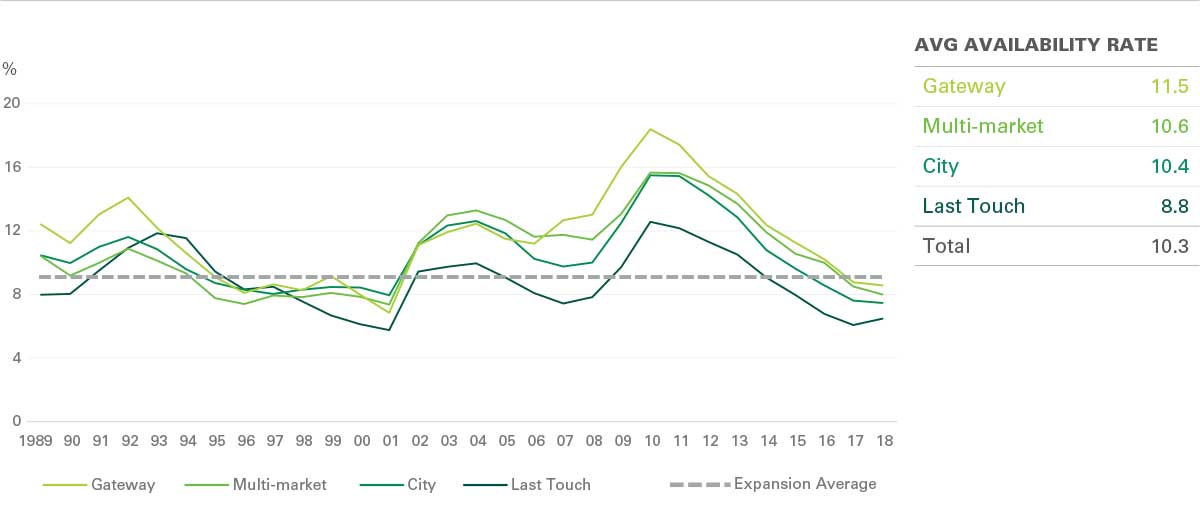
As a result, demand surged for Last Touch and City distribution—at least until potential users bumped up against capacity constraints. From 2010 to 2018, demand for these two property categories accelerated from prior cycles, while availability rates fell to new lows of about 6% and 7% for Last Touch and City, respectively.4 Absorption of Multi-market and Gateway properties also grew during this time, as reconfiguration for globalization and the decentralization of supply chains continued to drive demand.
Exhibit 3
AVAILABILITY RATE BY PROPERTY CATEGORY
Supply constraints necessary for sustained outperformance
Yet, demand is only half of the equation. In instances where new demand can be met with an equal or greater amount of supply, income and value growth will be tempered accordingly. The factors that keep developers from bringing on new supply generally fall into three buckets of “constraint”: geographic (i.e., a body of water or mountain range that limits available land); regulatory (i.e., as zoning restrictions that limit land available for industrial uses); and financial (i.e., high land and construction costs that reduce the potential ROI from a development project to less than is needed to justify the risk). Please see Appendix 2 for more detail on supply constraints.
Due to their urban infill locations in the most densely populated areas, Last Touch properties exhibit the greatest barriers to new supply, with the lowest correlation between absorption and completions over the past several decades [see Exhibit 4]. This tells us that even when demand surges, developers cannot respond with a corresponding level of new supply.
Exhibit 4
CORRELATION BETWEEN DEMAND AND SUPPLY
1989-2018; supply lagged by one year

In the absence of supply constraints, shifts in demand produce increased supply
Ultimately, as demand shifted to Gateway and Multi-market properties in the 1990s through the 2000s, new supply followed in locations with low barriers to new supply—a pattern that has continued through the current cycle. Looking at the past four quarters of development starts, activity has been highly concentrated in low-barrier City, Multi-market and Gateway properties [see Exhibit 5].
Exhibit 5
DEVELOPMENT STARTS BY PROPERTY CATEGORY, U.S.
MSF, trailing 4 quarters
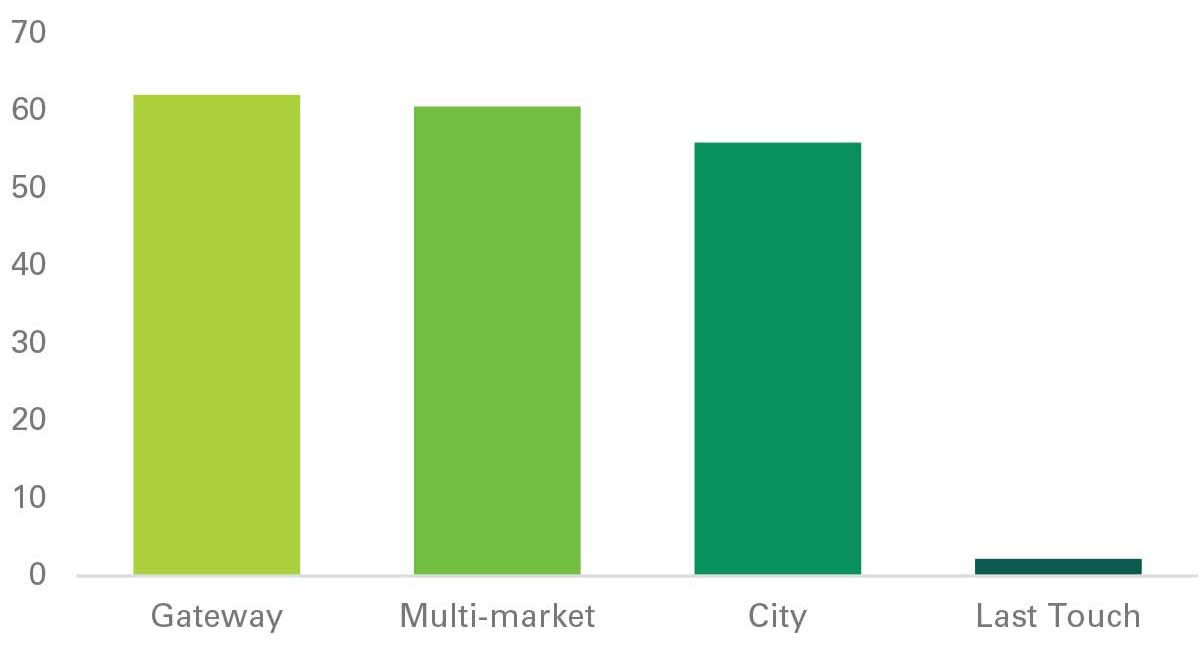
Note: Data based on U.S. markets in which Prologis has a presence.
In high-barrier locations, shifts in demand drive up rental rates
The disconnect between demand and supply is the most pronounced for Last Touch. With growing demand for space near end consumers and the highest barriers to new supply, availability rates have fallen to record lows. In response, potential users of Last Touch logistics real estate have bid up rental rates over the past several years, widening the gap between in-place and market rents.
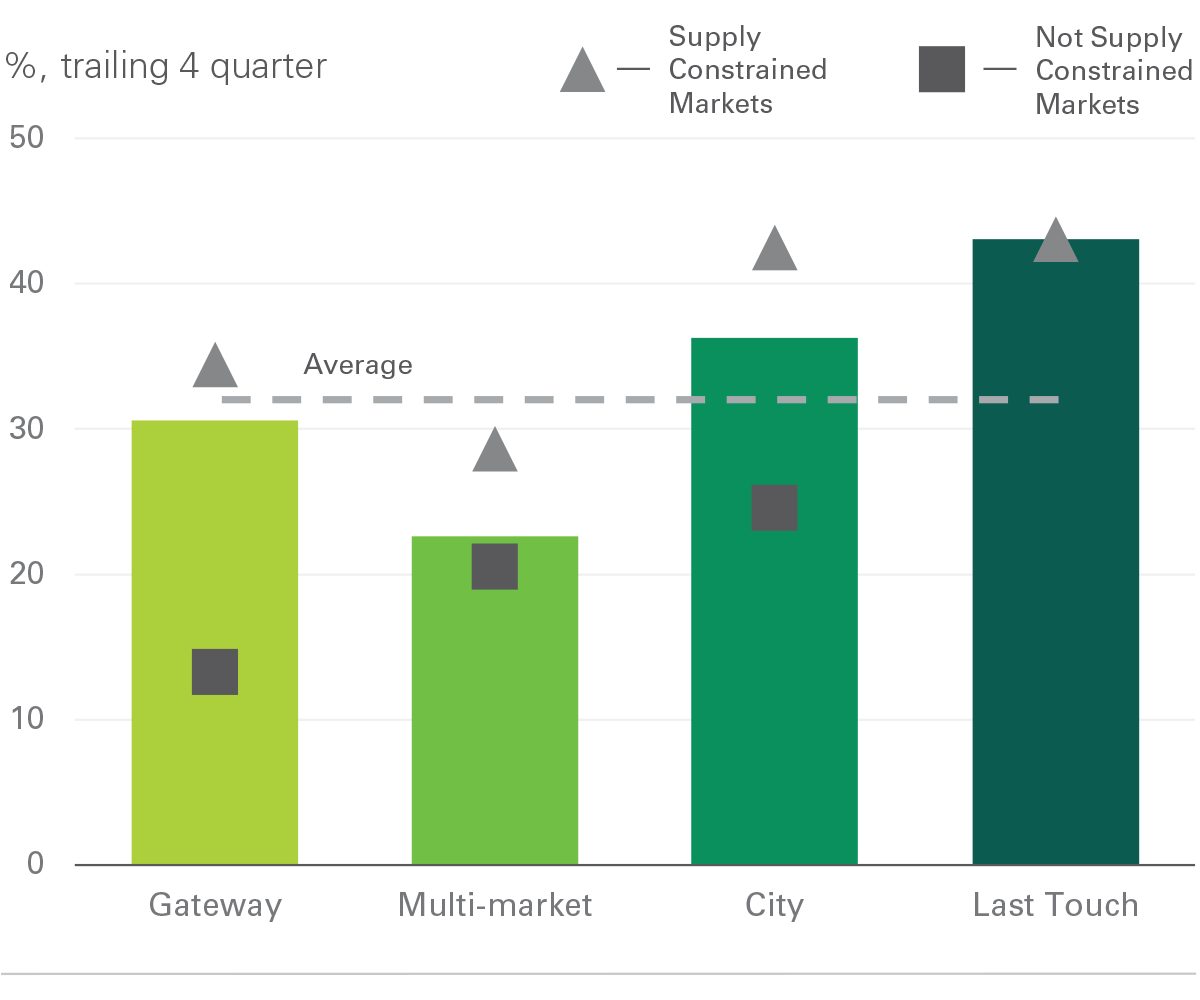
The resulting differences between categories—and between high- and low-barrier locations within categories—is reflected in rent increases on new leases, known as rent change on rollover [see Exhibit 6]. Last Touch and high-barrier City distribution properties record greater than 40% rent change, while low-barrier City, Multi-market and Gateway properties range from roughly 15-25%. This underscores the notion that not all locations are created equal, even within a category, and that a more precise understanding of both demand drivers and supply constraints is required to create and capture value.
Exhibit 6
RENT CHANGE ON ROLLOVER BY PROPERTY CATEGORY, PROLOGIS
The combination of demand shifts and supply shifts determine long-term real estate performance outcomes
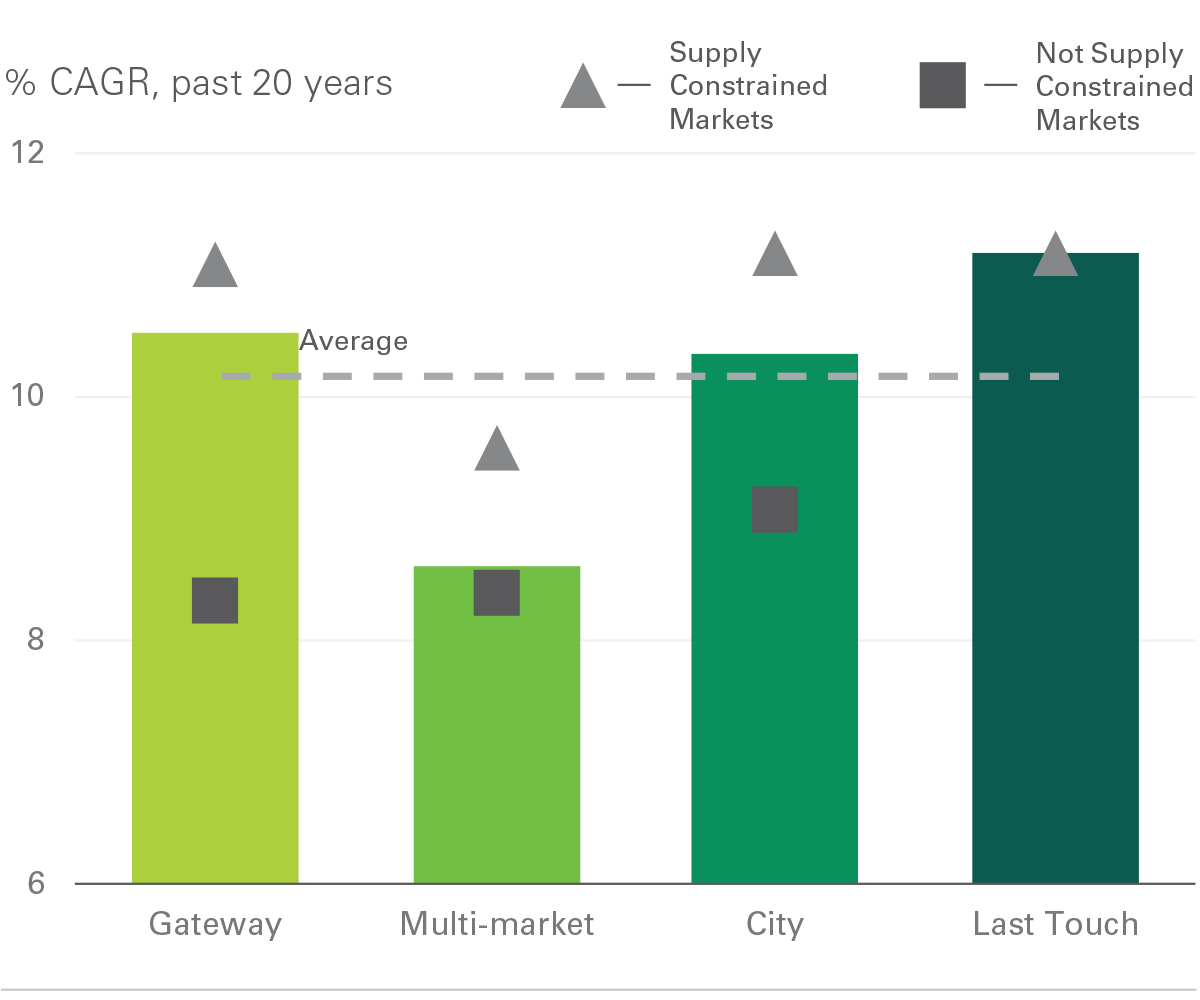
By digging deeper into the ability (or lack) of supply to meet rising demand, we can isolate outperformance even within property categories. In the case of globalization and Gateway properties, for example, markets that benefit from a major sea or intermodal port presence can be divided into high-barrier locations (i.e., New Jersey/ New York City, Southern California and Seattle) and low-barrier locations (i.e., Dallas, Atlanta and Chicago). Over the past 20 years, the compound annual total returns for high-barrier Gateway properties was 11.1% versus 8.3% for low-barrier properties—representing an outperformance of 280 bps per year [see Exhibit 7]. This spread is 210 bps for City distribution properties and 120 bps for Multi-market properties during the same time period. Taken together, value growth for high-barrier locations is roughly 2x low-barrier, with a similar ratio of outperformance for Last Touch vs. other categories.
Exhibit 7
TOTAL RETURNS BY PROPERTY CATEGORY AND SUPPLY BARRIERS, NCREIF
Today’s performance indicators reflect the early stages of supply chain shifts
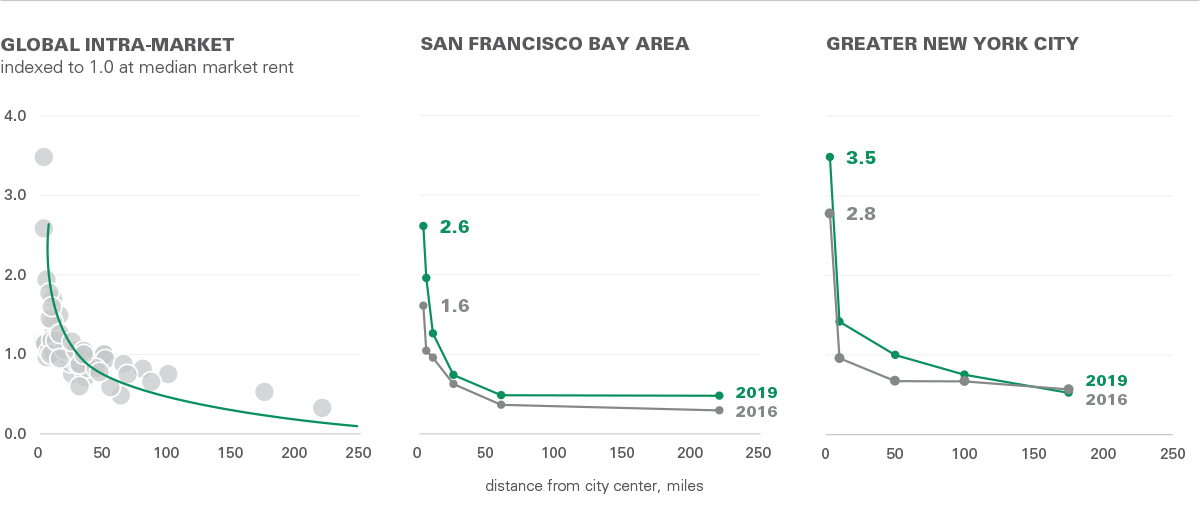
Based on history, structural supply chain shifts require multiple cycles. To better understand where market dynamics may be going, we looked at the evolution of pricing power within and between cities to assess the value generated when logistics customers are closer to end consumers. This value is captured in the form of higher rents. Prologis Research has studied proximity premiums for the top ten global consumer markets and has found (1) evidence of a steep curve for rents by distance to city center and (2) evidence that the curve is steepening over time [see Exhibit 8].
Greater New York City is the most mature market in the U.S., with the highest density, consumption potential and traffic congestion—making it both the greatest revenue generation opportunity and one of the most challenging to navigate. As a result, rent premiums for a location 10 miles from the center of Manhattan are 3.5x the average rental rate in New York, up from 2.8x just three years prior. While we do not expect many markets to match New York’s multiple anytime soon, there is a wide gap between this market and similar ones, such as the San Francisco Bay Area. Despite its high density, affluent consumer population and congestion, the SFBA premium is only 2.6x, up from 1.6x in 2016.
As cities, consumers and supply chains continue to evolve, these differences are likely to become more pronounced. Over the medium to long term, it is likely that the rent curves in major metropolitan areas will steepen further as the benefits of proximity grow amid urbanization and service level expectations. These benefits should outweigh higher real estate costs in an environment of increased competition for space and limited new supply.
Exhibit 8
Note: Prologis' infill premium is defined as the market rental rate in the given submarket divided by the median market rental rate for the entire market. "Global intra-market" includes the market rents at the submarket level of ten major consumption markets across the world.
The future of supply chains and logistics real estate builds on long-term structural trends
Tying together recent trends among logistics real estate users, the competitive environment should continue to prioritize revenue generation, largely by meeting consumer expectations for ever-faster delivery, greater product variety and increased convenience. To accommodate these parameters, inventory must be stored close to consumers and move quickly through supply chains—or, ideally, both.
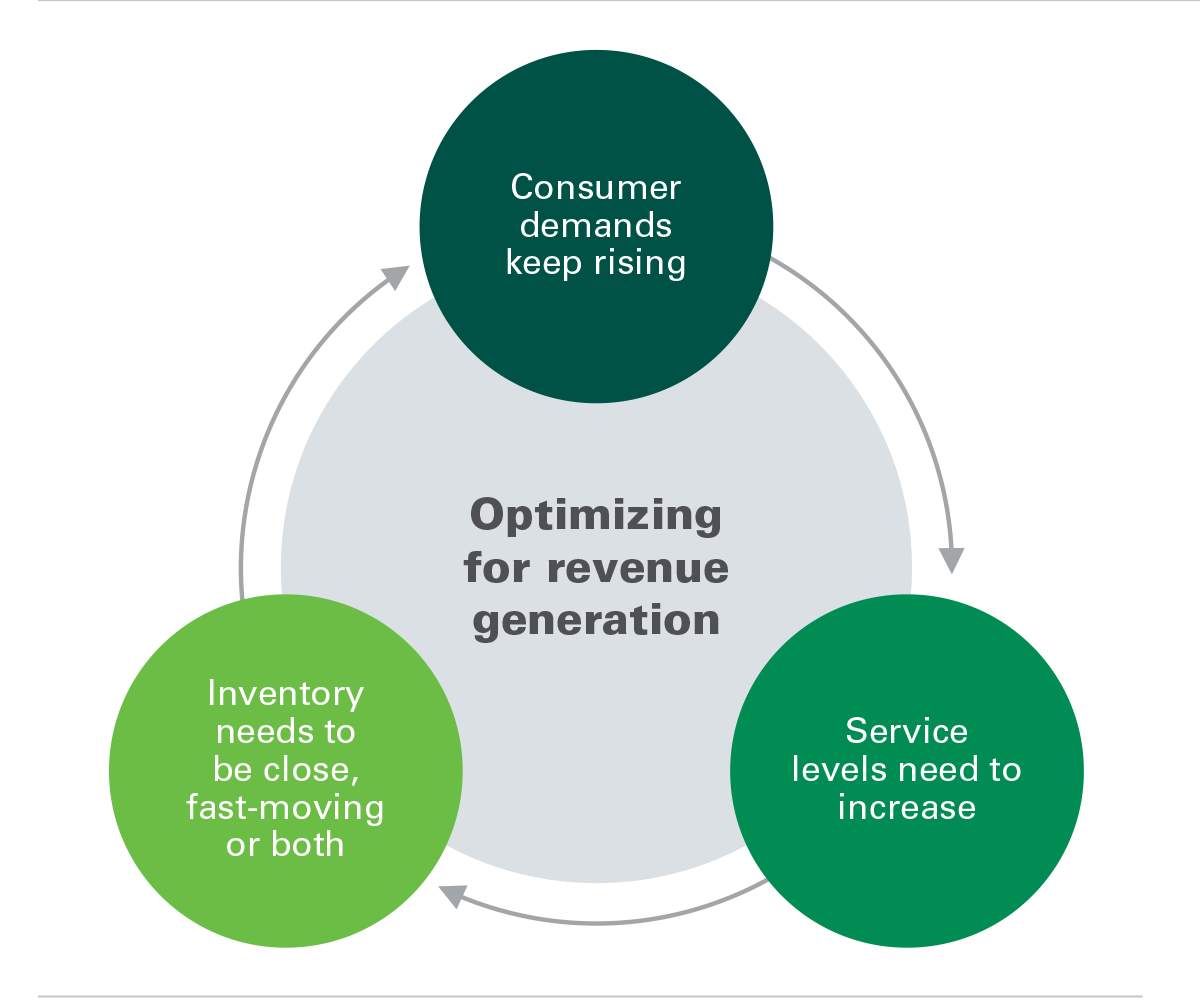
This strategy should place higher value on logistics real estate at the Last Touch and City distribution stages of the modern supply chain. Further, service expectations can be met through the rapid flow of goods through supply chains aided by highly functional and well-located facilities at the earlier stages of the supply chain—in particular, the first point of entry in a Gateway property.
Summary
By viewing the modern supply chain through a filter of responsiveness and constraints specific to each segment, we anticipate the emergence of important opportunities to utilize rising pricing power to meet a spectrum of logistics demand. Developers who can meet the challenge and help customers adapt to today’s modern supply chain should be rewarded with higher long-term returns.
Appendix 1: Notes on Methodology
Property categorization
Details on the model for determining property categories can be found in the first installment of our property categorization report: The Modern Supply Chain: A New Model for Defining Logistics Real Estate.
Availability vs. vacancy rate
In order to analyze historical trends, Prologis Research relied on data from CBRE-EA, which reports most variables back to 1989. However, data is not available for vacancy until 2002, so market competitiveness is reflected through the availability rate.
Generally, availability is higher than the vacancy, with an average spread of 163 bps from 2002 through 2018. The availability rate is the sum of vacant space and occupied space that is available for rent as a percent of total inventory. Vacant space only includes space that is both vacant and available for lease as a percent of total inventory.
Translating building-level analysis to third-party data
Throughout the paper, property categories are applied at the smallest geographic unit possible. Naturally, the larger the aggregation area, the less precise the relationship between category and trend. But given the high-level of the analysis, trends are believed to be directionally correct.
Prologis data incorporates property categories analysis applied at the building level.
NCREIF data is at the zip code level; zip codes are categorized based on the frequency of observations within that zip code.
CBRE-EA data is at the submarket level; submarkets are categorized based on the frequency of observations within that submarket.
Appendix 2: Supply-constrained Locations
The list of markets with supply constraints is based on Prologis development team assessments and proprietary data on replacement costs and supply trends. Factors assessed include geographic barriers that limit available land, density of the existing built environment, regulatory hurdles such as entitlement, land/construction costs, and difficulty securing development inputs such as labor. Please note that this is a market-level assessment; within select markets and submarkets, there are signs that barriers to supply are rising. This is particularly true is fast-growing areas, for example, Southeast Nashville.
Supply Constrained
Greater NYC
Southern California
Northern California
South Florida
Seattle
Washington, DC
Boston
Austin
Portland
Endnotes
- Last Touch is a registered trademark of Prologis, Inc.
- Prologis Research analysis of CBRE-EA data, which begins in 1988
- CBRE-EA, Prologis Research
- CBRE-EA, Prologis Research
Forward-Looking Statements
This material should not be construed as an offer to sell or the solicitation of an offer to buy any security. We are not soliciting any action based on this material. It is for the general information of customers of Prologis.
This report is based, in part, on public information that we consider reliable, but we do not represent that it is accurate or complete, and it should not be relied on as such. No representation is given with respect to the accuracy or completeness of the information herein. Opinions expressed are our current opinions as of the date appearing on this report only. Prologis disclaims any and all liability relating to this report, including, without limitation, any express or implied representations or warranties for statements or errors contained in, or omissions from, this report.
Any estimates, projections or predictions given in this report are intended to be forward-looking statements. Although we believe that the expectations in such forward-looking statements are reasonable, we can give no assurance that any forward-looking statements will prove to be correct. Such estimates are subject to actual known and unknown risks, uncertainties and other factors that could cause actual results to differ materially from those projected. These forwardlooking statements speak only as of the date of this report. We expressly disclaim any obligation or undertaking to update or revise any forward-looking statement contained herein to reflect any change in our expectations or any change in circumstances upon which such statement is based.
No part of this material may be (i) copied, photocopied or duplicated in any form by any means or (ii) redistributed without the prior written consent of Prologis.
About Prologis Research
Prologis’ Research department studies fundamental and investment trends and Prologis’ customers’ needs to assist in identifying opportunities and avoiding risk across four continents. The team contributes to investment decisions and long-term strategic initiatives, in addition to publishing white papers and other research reports. Prologis publishes research on the market dynamics impacting Prologis’ customers’ businesses, including global supply chain issues and developments in the logistics and real estate industries. Prologis’ dedicated research team works collaboratively with all company departments to help guide Prologis’ market entry, expansion, acquisition and development strategies.
About Prologis
Prologis, Inc. is the global leader in logistics real estate with a focus on high-barrier, high-growth markets. As of September 30, 2019, the company owned or had investments in, on a wholly owned basis or through co-investment ventures, properties and development projects expected to total approximately 797 million square feet (74 million square meters) in 19 countries. Prologis leases modern logistics facilities to a diverse base of approximately 5,100 customers principally across two major categories: business-to-business and retail/online fulfillment.

