Not all logistics real estate is created equal. With a range of features and locations, properties can have widely different purposes, yet current industry definitions seldom go farther than “warehouse/distribution” and “flex”. Given the growing need to secure the right building in the right location to meet rising service level expectations, a common language is needed to describe the different types of logistics real estate.
In this paper, Prologis Research delivers this lexicon, and details how to categorize logistics real estate properties by segment of the modern supply chain using site selection criteria.
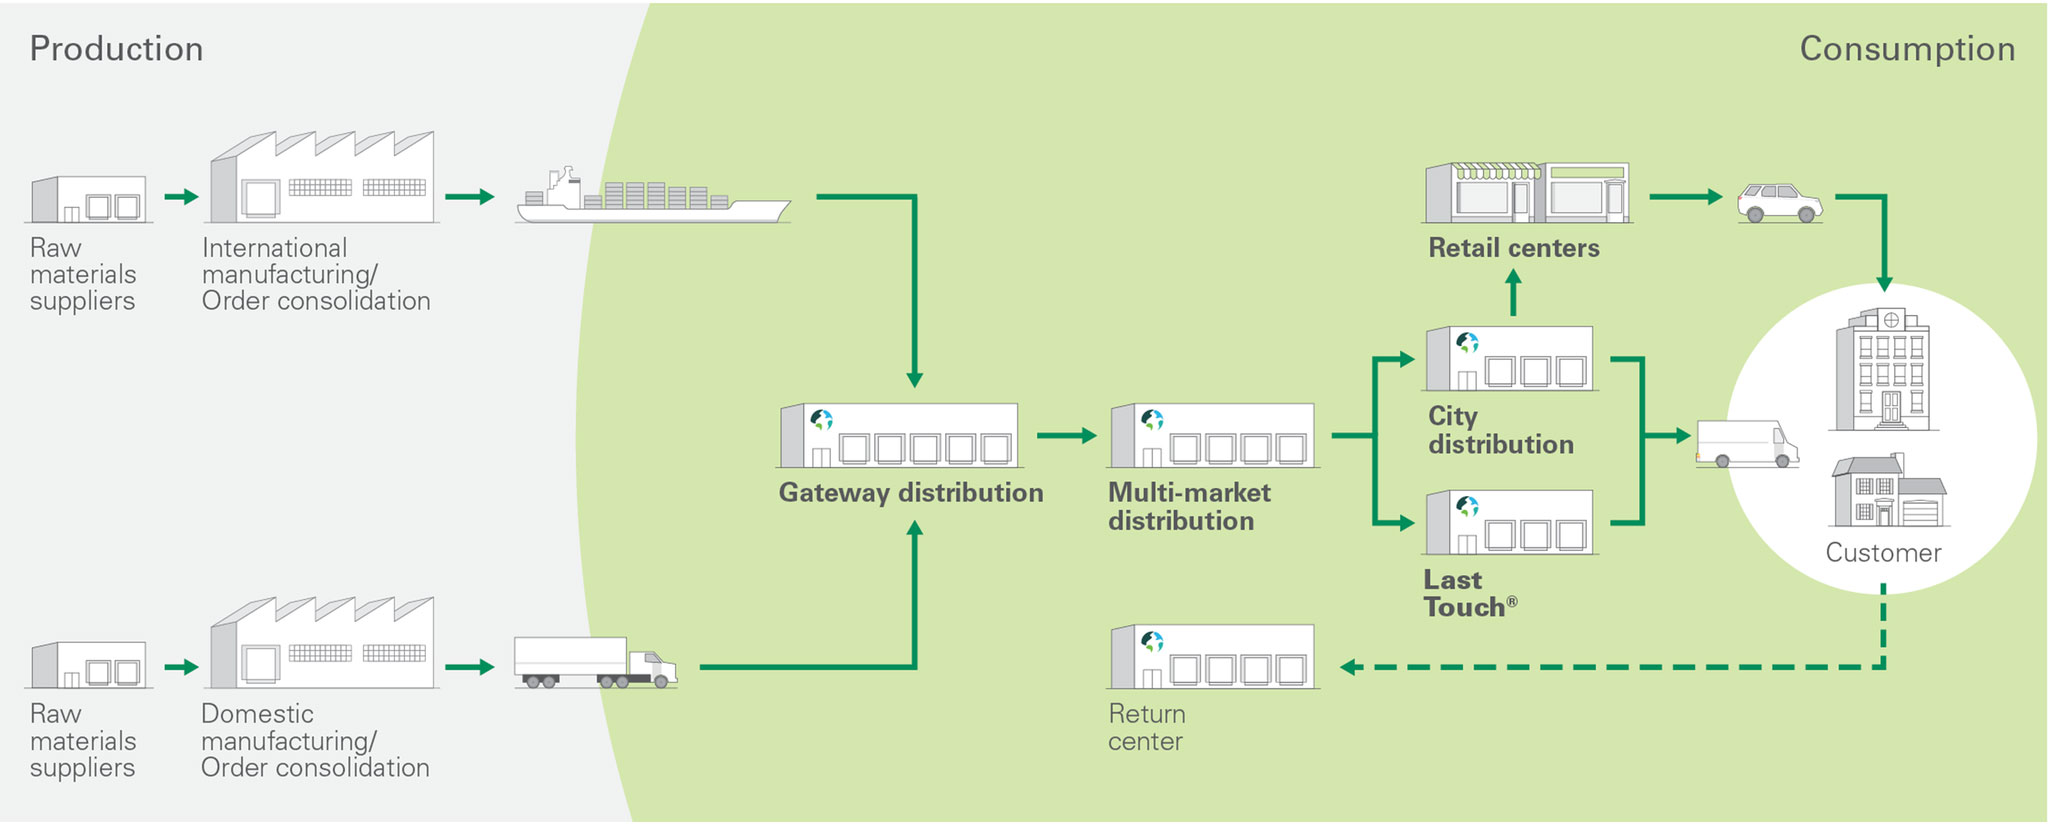
The supply chain extends from the point of production to the point of consumption. Products often stop at several points along the way [see Exhibit 1]. Our focus is on the consumption end of the modern supply chain, where new requirements are being generated by e-commerce and higher service-level expectations. On the consumption side of the logistics supply chain, we have defined four main categories:
- Last Touch®1 properties can reach large dense, affluent populations within hours. These buildings typically are the oldest and smallest, because they are in very infill locations.
- City Distribution properties are well-positioned to provide 1-2 day shipping to an entire large market. These buildings tend to be small to mid-sized and located in urban areas.
- Multi-Market distribution facilities must have the right balance between location and functionality. These buildings tend to be newer and larger and located at key transportation hubs at the periphery of major urban areas.
- Gateway facilities are multi-market buildings that incorporate access to major sea and intermodal ports.
Exhibit 1
THE MODERN SUPPLY CHAIN
Framework for categorizing logistics real estate built on three key questions:
1. What differentiates the segments of the modern supply chain and related property categories?
Urgency.
2. What is the underlying demand driver for most logistics real estate users?
Consumption of goods.
3. What is the end goal of site selection in the modern supply chain?
Operational efficiency for aggregation potential or high through-put of goods.
By focusing on these three key factors, we developed a data-driven methodology that connects logistics real estate with the flow of goods through supply chains. In this paper, we define the different categories by urgency, detail our approach to measuring consumption, and lay out the site selection criteria used to determine operational efficiency at each segment of the supply chain. This site selection approach starts with aggregation potential, first at the market and then location level, then delves into considerations for high through-put operations. Finally, we analyze the characteristics of buildings within each category to illustrate the location-functionality trade-off at each segment of the supply chain.
Urgency drives segmentation of the modern supply chain
The categories are differentiated primarily by the amount of time goods spend traveling between a facility and their next (or final) destination:
- Delivery times from Last Touch facilities can be measured in hours. As a result, location characteristics for this segment are the most similar to retail.
- City distribution facilities are designed for 1-to 2-day shipping.
- Gateway and Multi-Market distribution facilities can reach multiple markets within one day’s truck drive.
Location and functionality: The two key factors for operational efficiency
- For Last Touch, the efficiency of a location can be measured by the time between the facility and consumer doorsteps. Building-level characteristics are often secondary to location considerations.
- For City Distribution, location is also paramount to efficiency, but with less urgency as compared to Last Touch. From a City facility, users can distribute to households, retail centers or businesses.
- For Multi-Market distribution, effectiveness builds on transportation access to multiple consumption centers, as well as through building-level features such as size, clear height, layout, parking, and dock doors that dictate functionality for High-Through-Put DistributionTM operations.
- For Gateway distribution, access to global trade routes is crucial, along with building-level features as described in the Multi-Market summary.
Data highlights segment of the supply chain
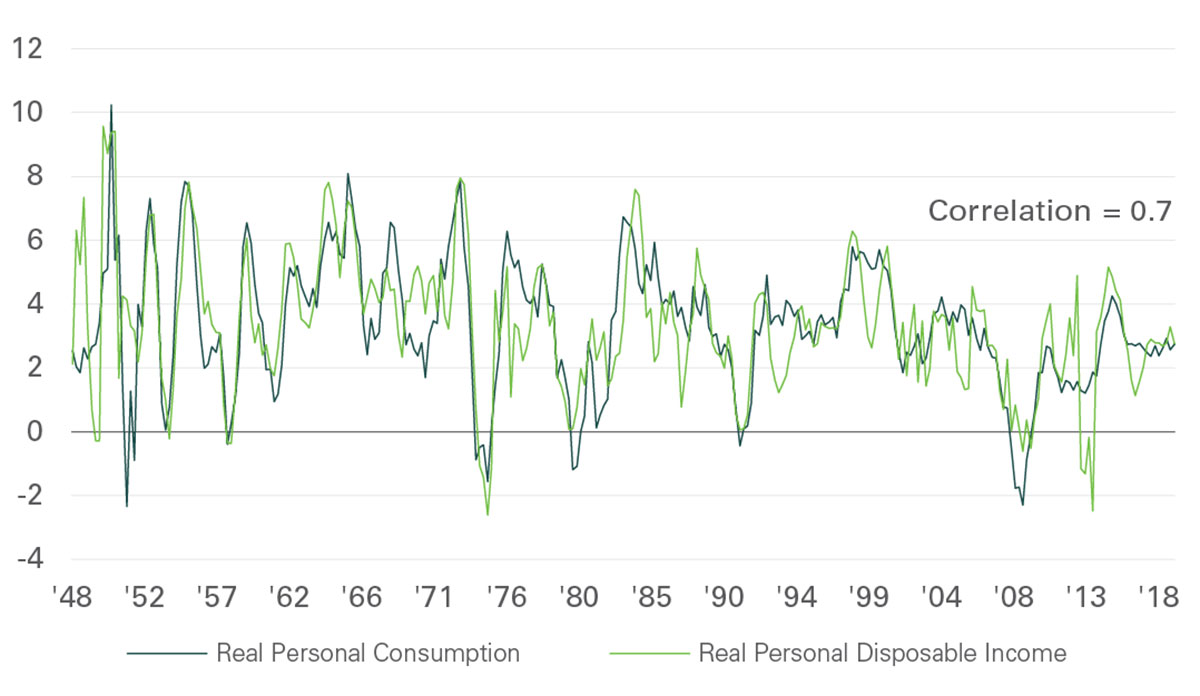
Site selection approach builds on proximity to consumer households. Data on income is reliable and highly correlated to consumption [see Exhibit 2]. Geospatial features ultimately determine reach, therefore drive times were used rather than distance whenever possible to capture differences in geographic features, transportation infrastructure and congestion.
Exhibit 2
INCOME AND CONSUMPTION
(%)
Not all markets warrant Last Touch and City distribution (yet)
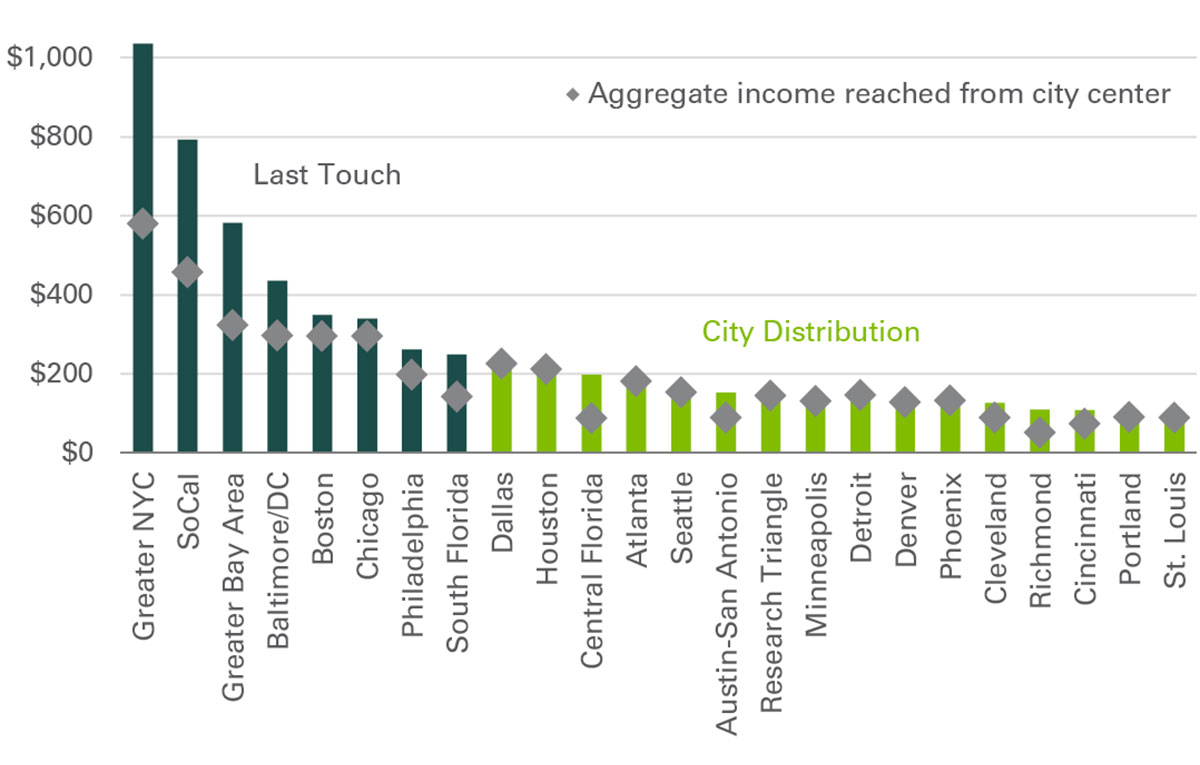
Meeting short delivery timeframes depends on aggregation potential. Larger and denser markets contain correspondingly larger aggregation potential within a given timeframe. Furthermore, the largest, densest markets often have the greatest challenges to on-time delivery (such as high congestion), which increases the importance of well-located facilities. Based on these principles and conversations with customers who are engaged in Last Touch and City distribution activities, the top 25 U.S. markets, with aggregate income of more than $100 billion, qualify for at least a City presence [see Exhibit 3] and the top eight markets, with aggregate income of more than $250 billion, are likely targets for a Last Touch operation. Around the world, major 24-hour cities generate the need for Last Touch operations; those cities include Tokyo, London, Shanghai, Paris and Mexico City.
Exhibit 3
AGGREGATE INCOME BY MARKET
(%,B)
Relative positioning crucial to Last Touch and City site selection
Location is key for these segments of the supply chain. A relative ranking based on income reach within a drivetime radius reveals the best and worst locations for Last Touch and City distribution within a market.
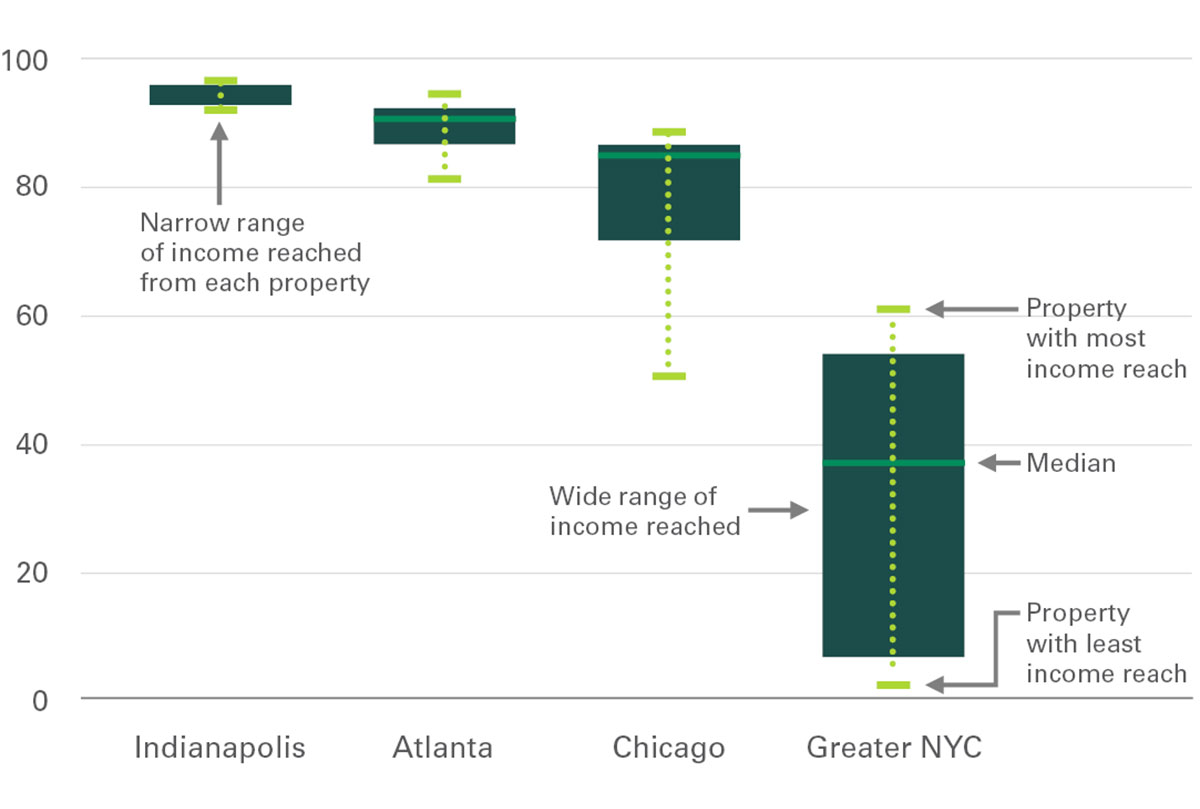
While a logistics real estate user may seek to offer a similar level of service across cities of a certain size, the nature of cities yields several differences crucial to site selection. First, the amount of income reached will vary substantially by market. To illustrate: Some $600 billion can be reached within one hour of the center of Manhattan while $180 billion can be reached from Atlanta’s city center. Second, the market penetration of any one facility will likewise vary – given the vastness and scale of New York City, for example this $600 billion translates to about 56% of total market income; in Atlanta, that figure is 94%. Lastly, the range of market penetration – the proportion of the total market income reached from a particular site – between building locations is more pronounced the larger and denser the market [see Exhibit 4]. Therefore, it is important to construct an index that reveals relative positioning within a market, and adjusts for the differences between markets.
Exhibit 4
MARKET PENETRATION RANGES
(%)
Income Reach adjusts for inter-market differences that impact Last Touch and City distribution
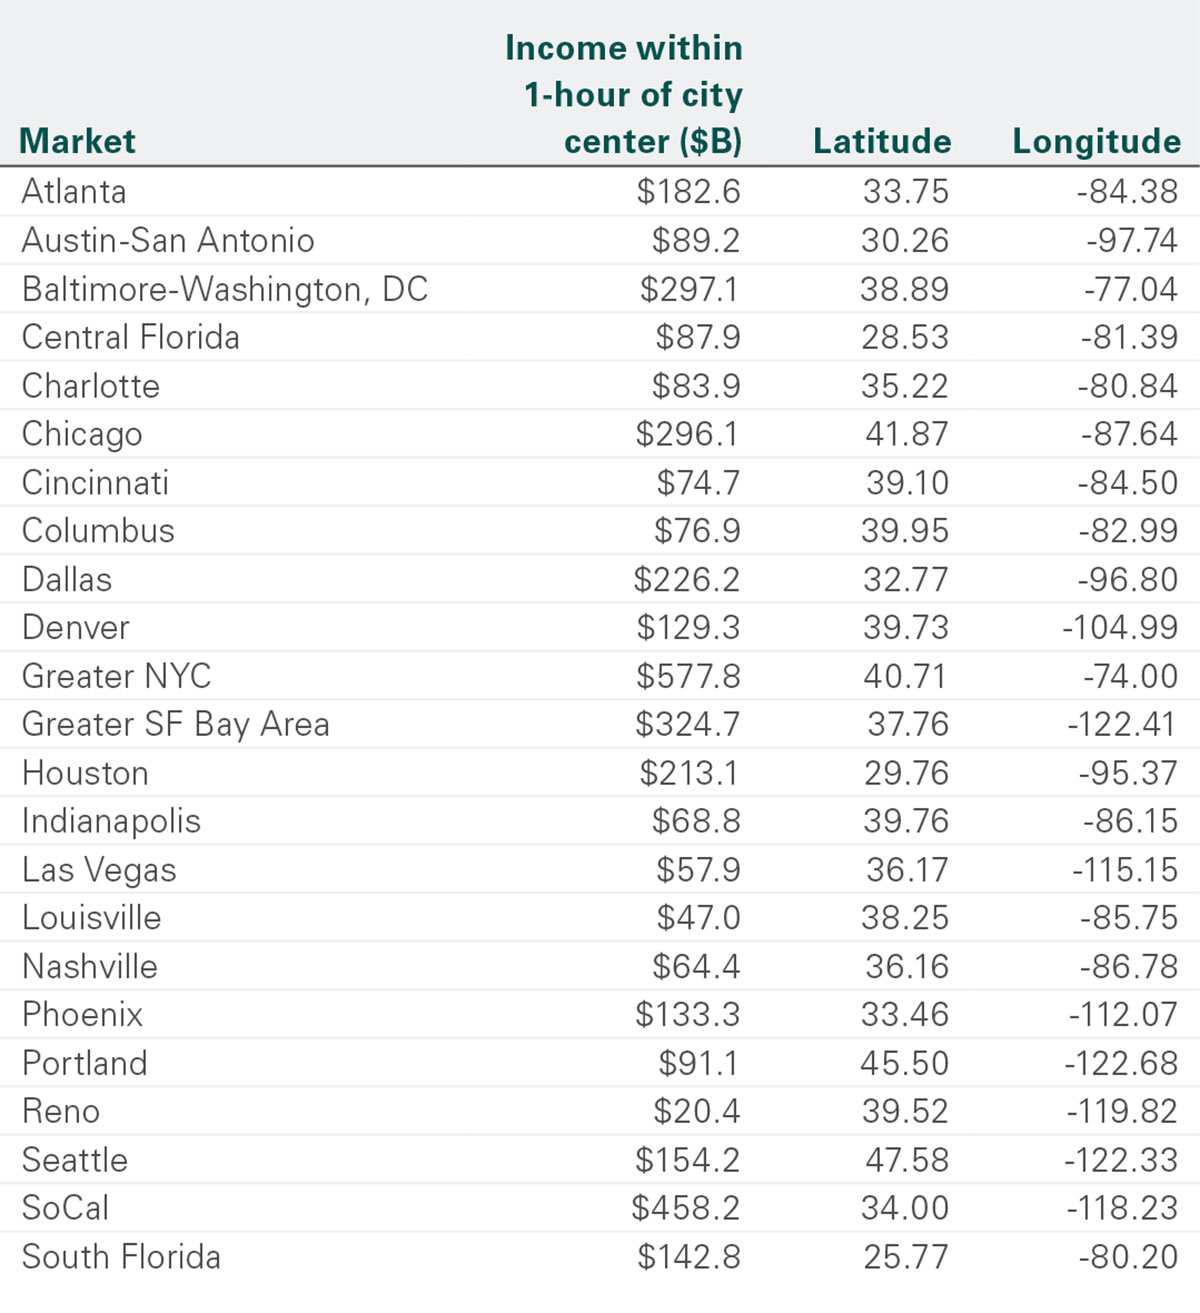
To calculate the “Income Reach” for a logistics real estate property, we divided aggregate income within a one-hour drivetime radius (during peak traffic) from that property by aggregate income for the same radius from city center [see Appendix 1 for exact figures].2 One hour was chosen based on requirements for logistics real estate users, its significance in determining rental rates, and cross-checking results with known parcel delivery networks.

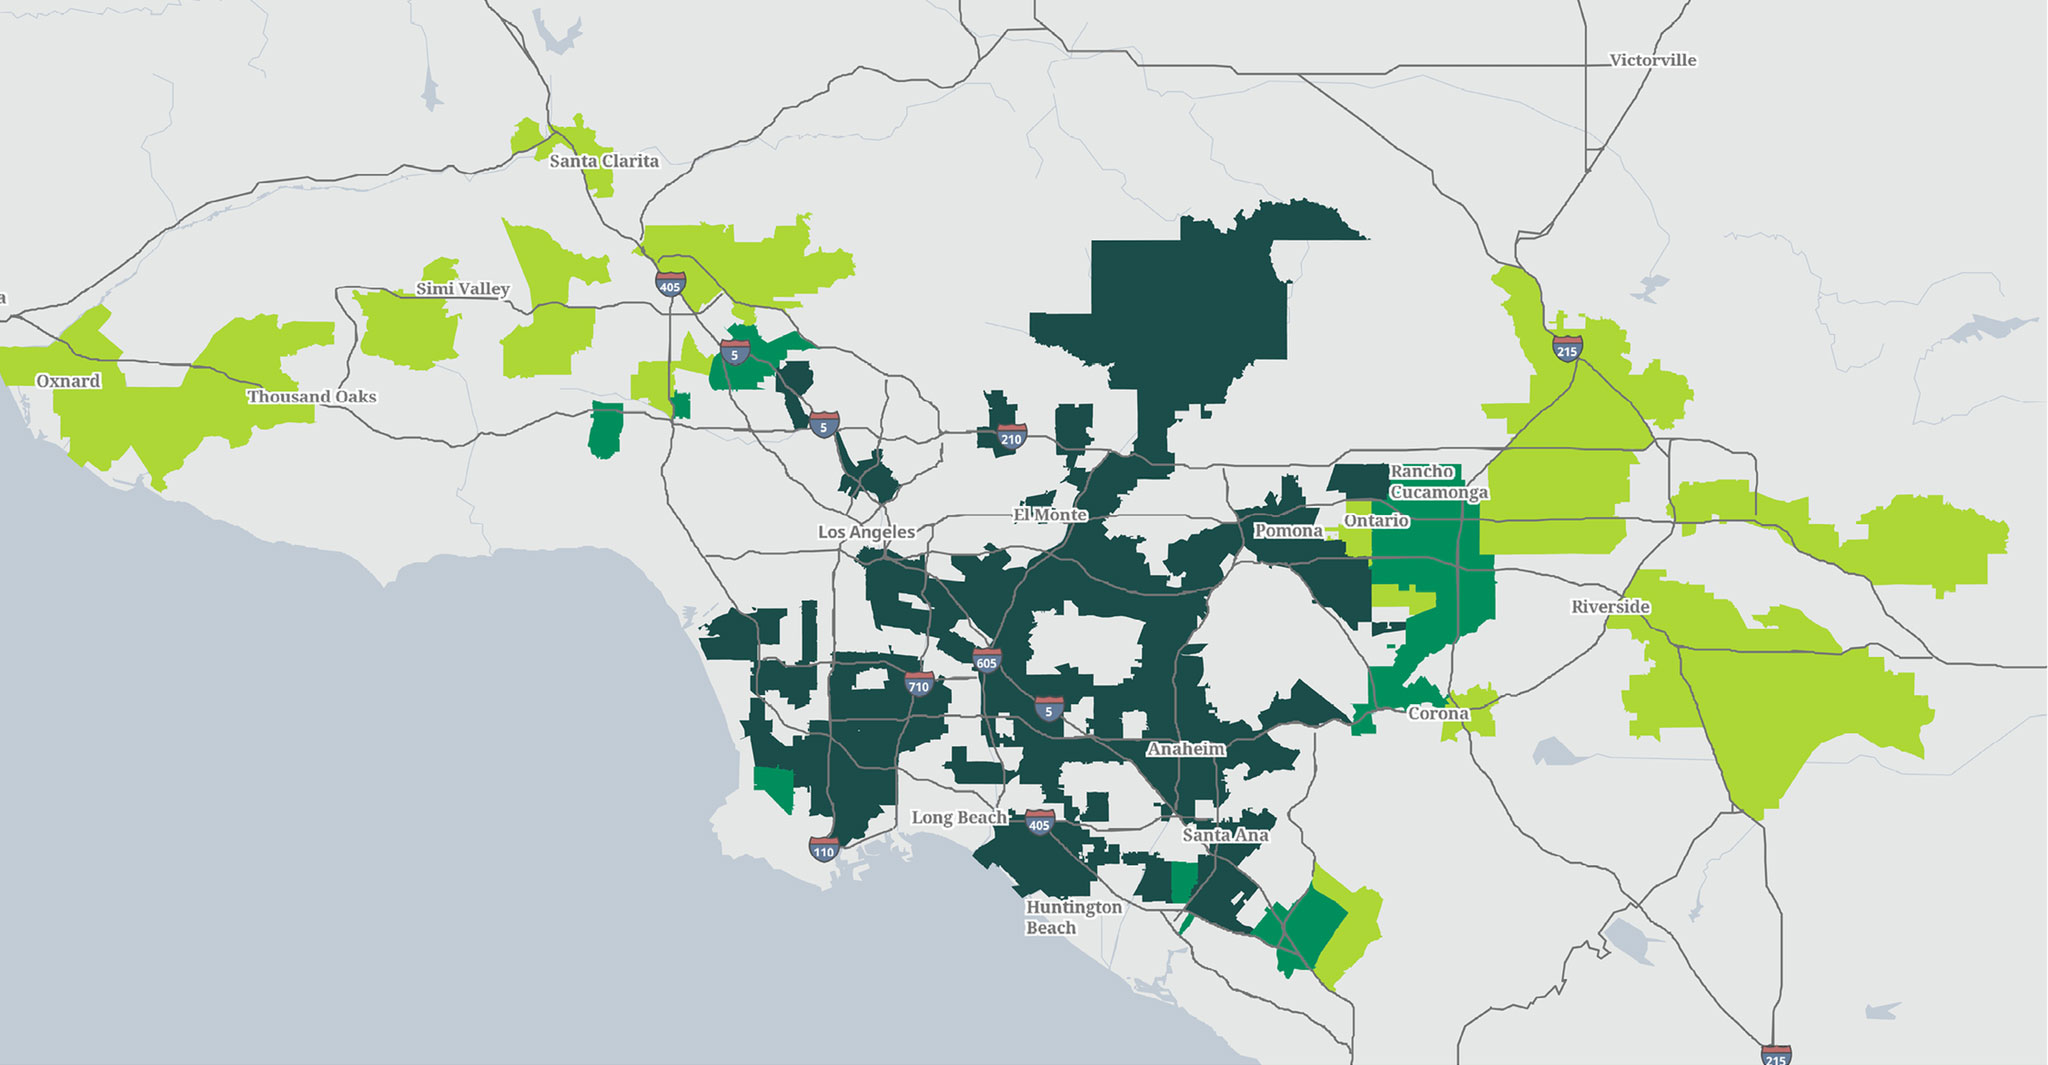
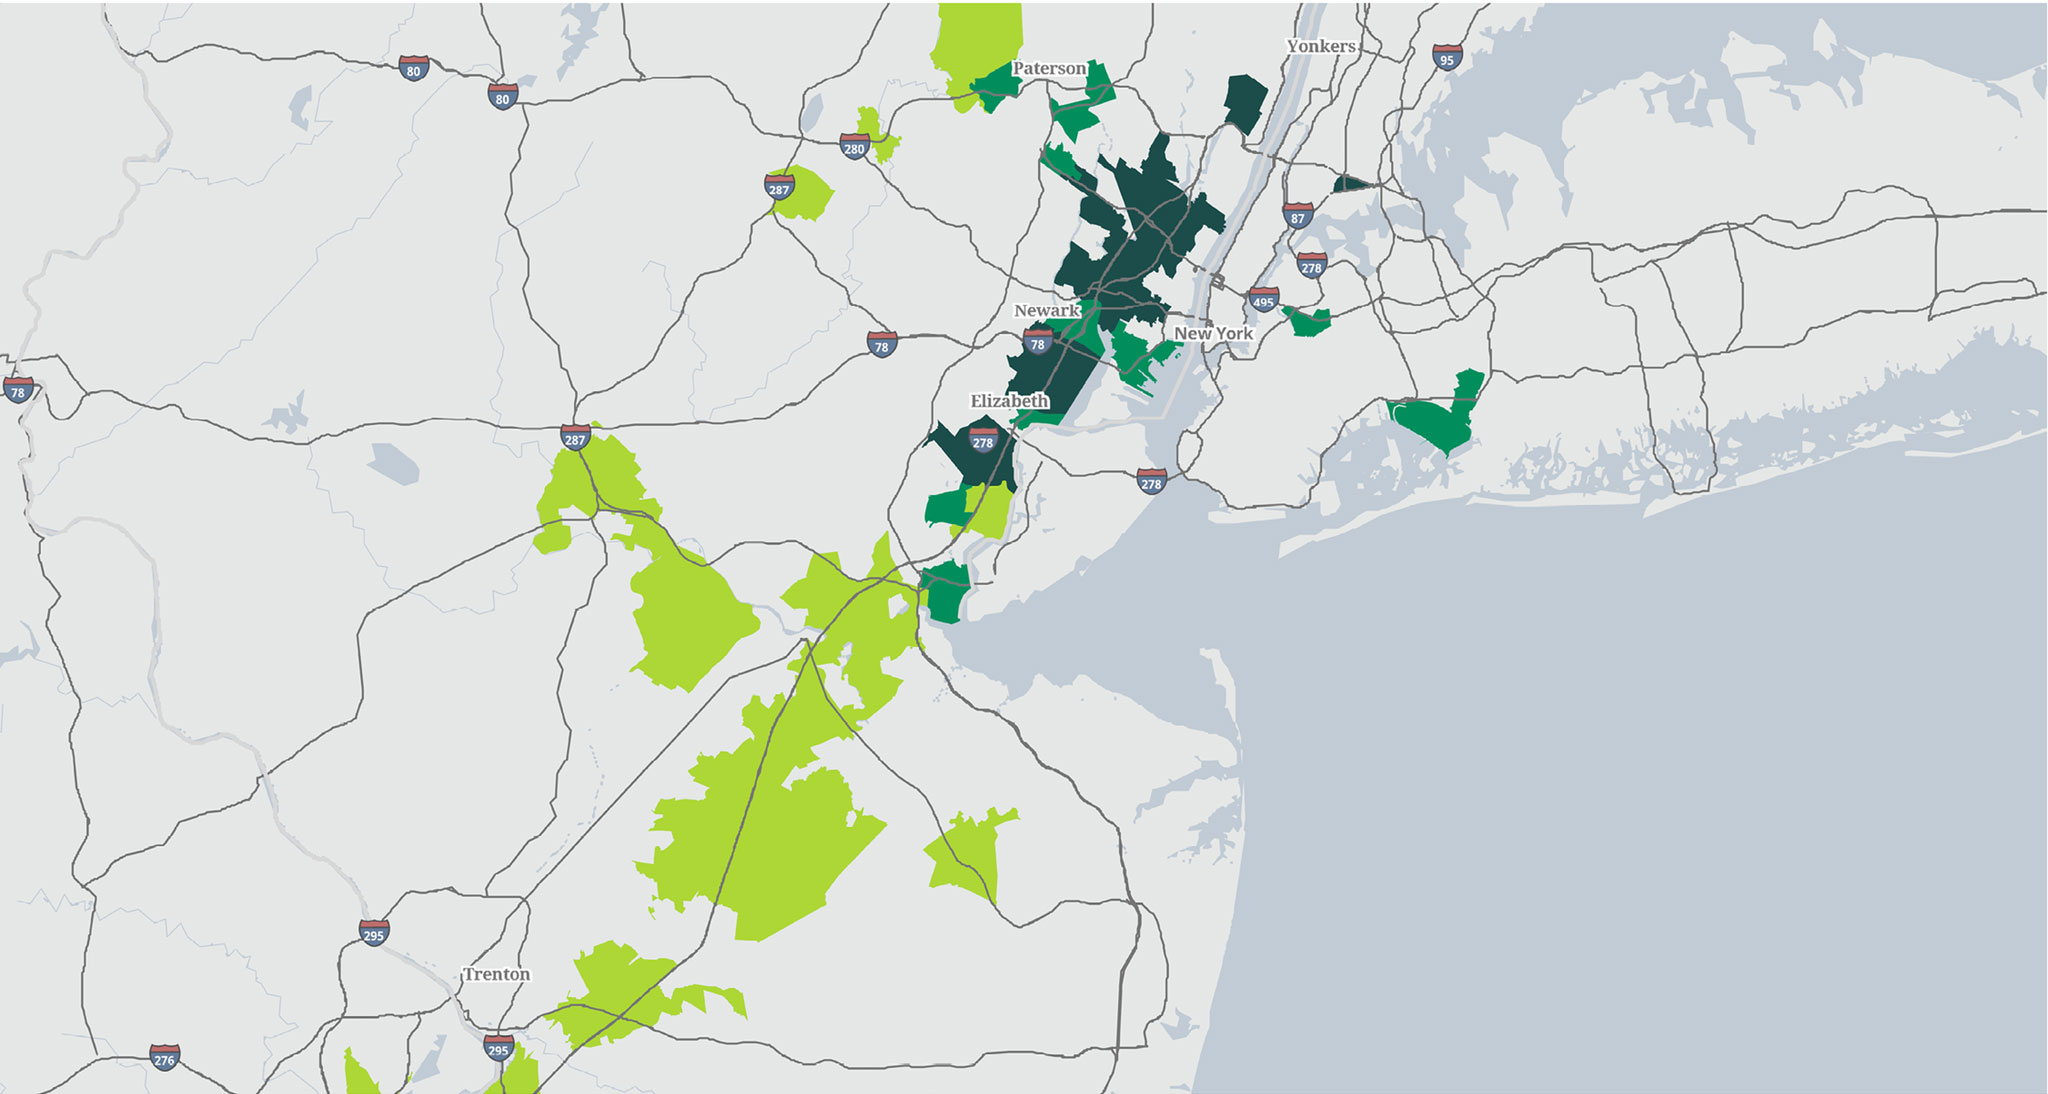
Last Touch locations have an Income Reach of 95% or higher; while City locations are 85% or higher [see Exhibits 5 and 6 for illustrative categorization results by zip code].3 The shorter the promised delivery timeframe, the more important it is to maximize aggregation potential, thus the higher cut-off for Last Touch. Additionally, to reliably deliver within a short timeframe, income reach for both Last Touch and City distribution facilities should consider peak traffic levels.
Exhibit 5
CATEGORIZATION MAP, SOUTHERN CALIFORNIA
Exhibit 6
CATEGORIZATION MAP, NJ/NYC
Gateway and Multi-Market distribution facilities balance location and functionality
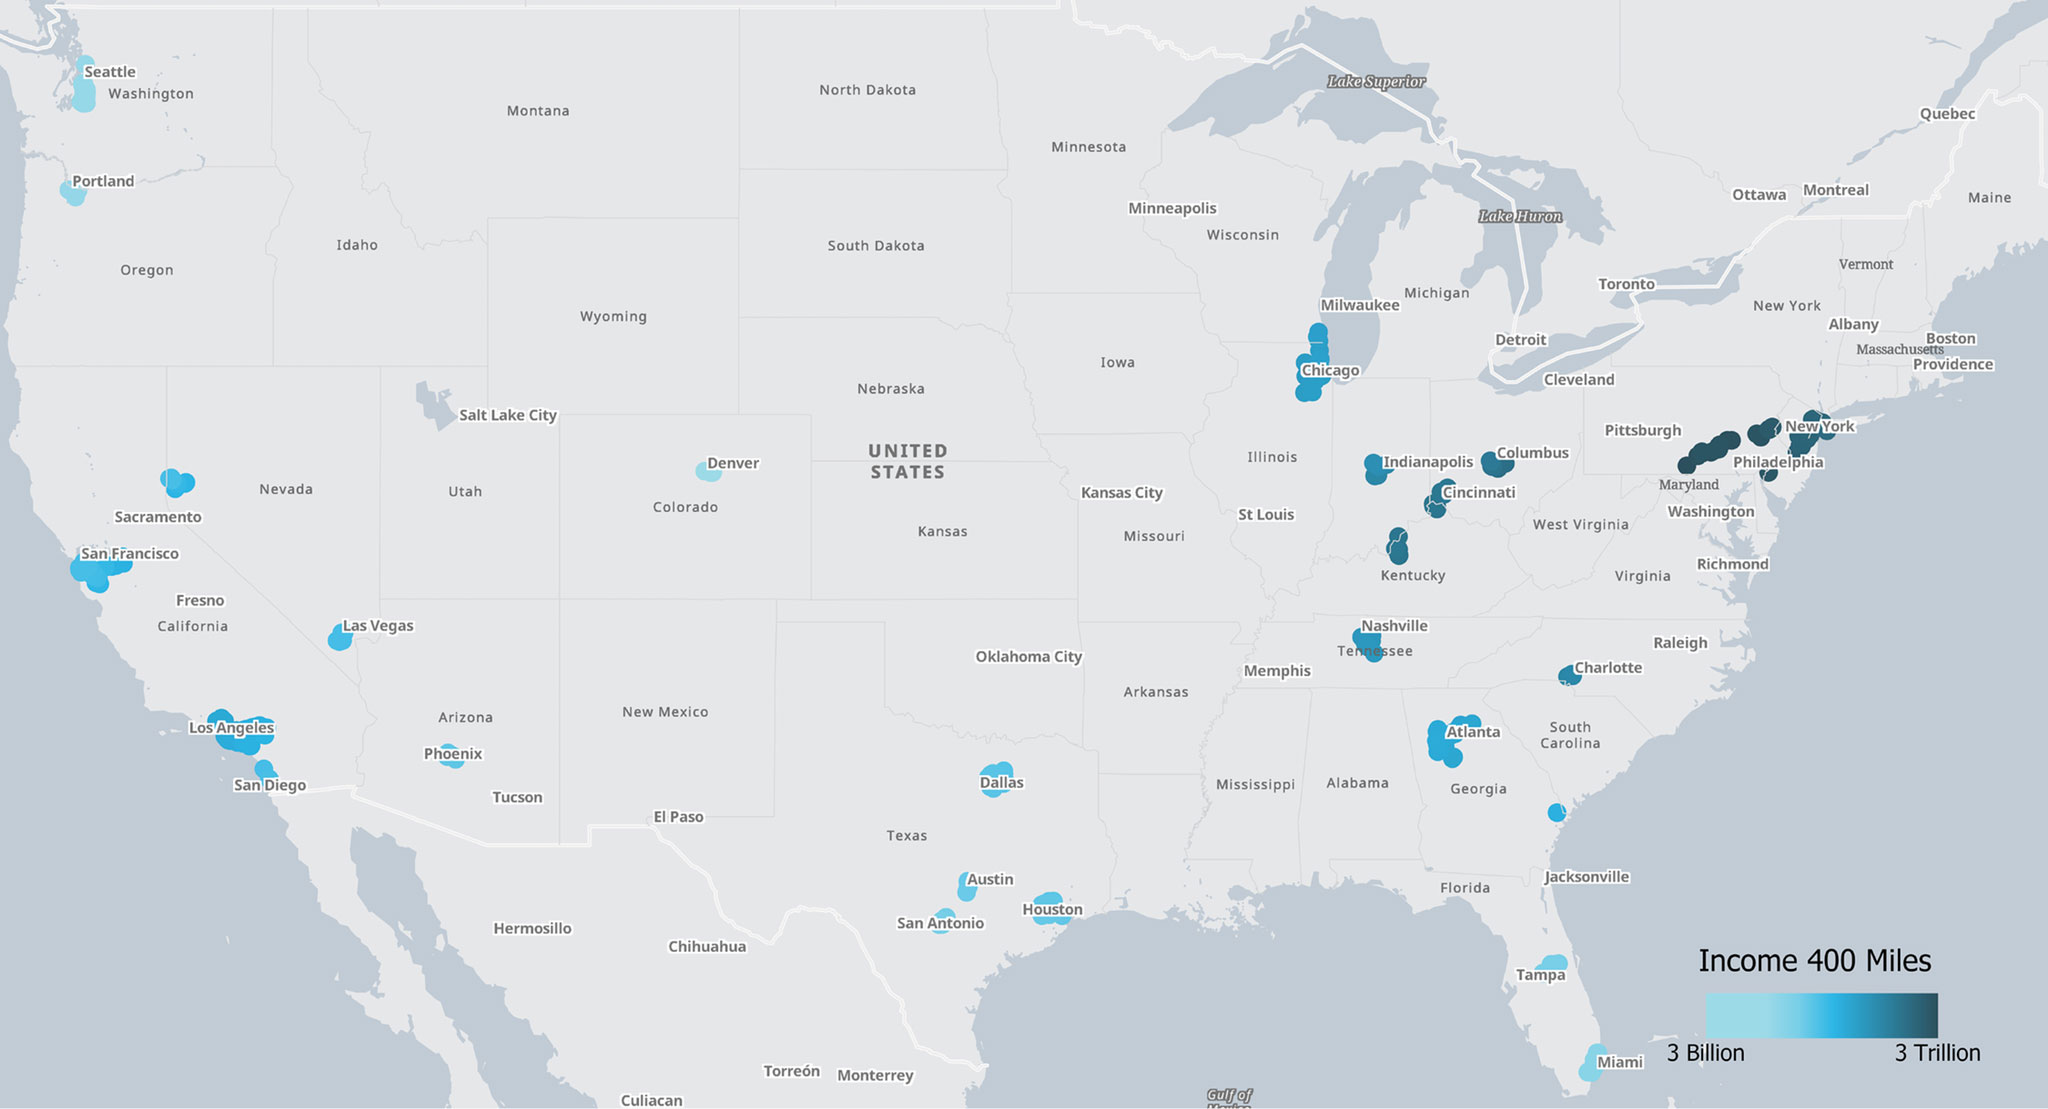
Like the first two categories, Gateway and Multi-Market facilities range in their effectiveness. A relative ranking based on the amount of income reached within one day’s truck4 drive can illuminate some of the most productive single locations for Multi-Market distribution [see Exhibit 7]. However, unlike planning routes for a single market, selecting the best Multi-Market facilities for full coverage of the continental U.S. will usually mean multiple locations that span a range of income access within a one-day drive; therefore, a ranking by this metric is not a useful qualification.
Exhibit 7
HEAT MAP - INCOME REACH WITHIN A DAY'S TRUCK DRIVE
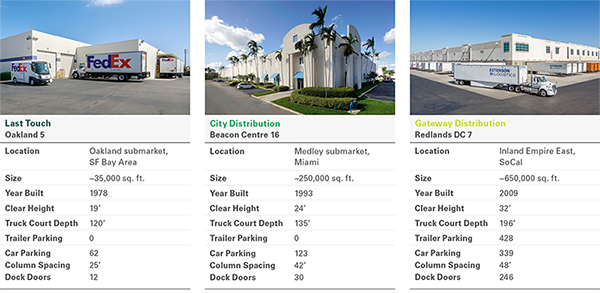
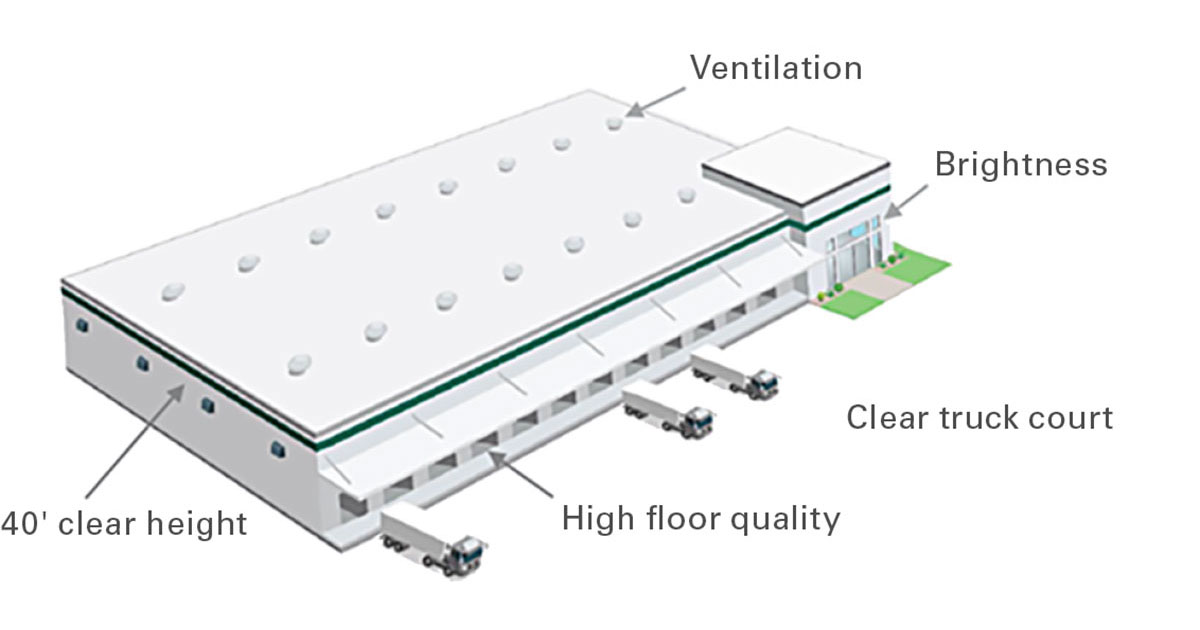
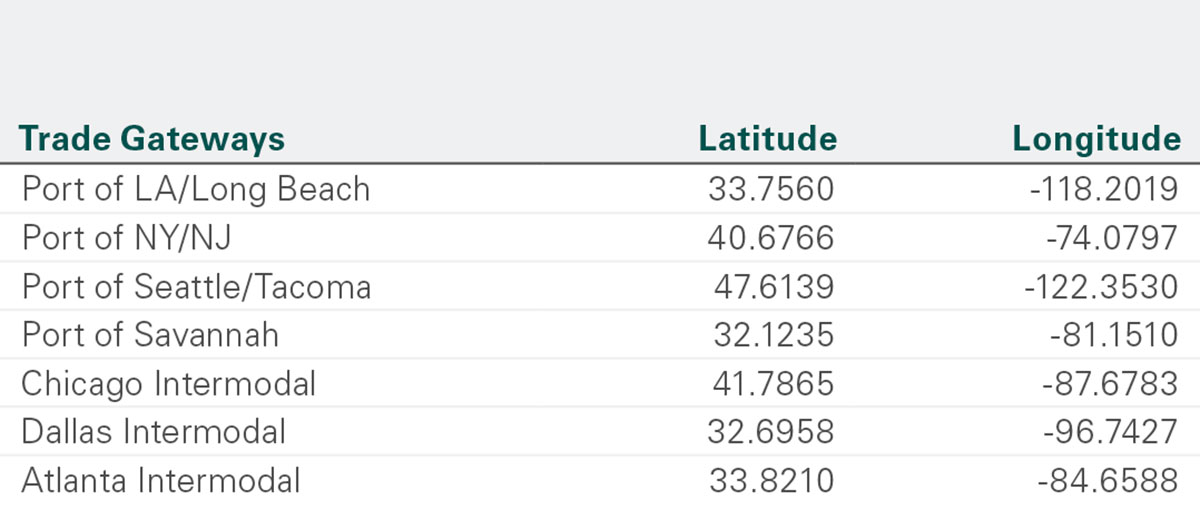
Furthermore, functionality and, in the case of Gateway distribution, trade route access play a significant role at these segments, when high through-put is crucial to achieving speed and efficiency through the entire supply chain. Users need to consider location, trade route access, and modern building specifications when choosing buildings for these purposes [see Exhibit 8]. Gateway activities are concentrated within two hours of major seaports (for example, Los Angeles/Long Beach, Hamburg and Shanghai) and major intermodal ports (for example, Chicago and Paris) [see Appendix 2 for a full list of U.S. ports used in this analysis].
Exhibit 8
MODERN BUILDING SPECIFICATIONS FOR GATEWAY AND MULTI-MARKET
Categorizing the segments
A rough estimate suggests that approximately 45% of the U.S. logistics real estate market is positioned for Multi-Market distribution—a share that has been growing over time—and 20% positioned for Gateway. About 25% is well-located for City distribution while only 10% is well-positioned for Last Touch operations. The proportion of each type of real estate varies widely by market. In Europe, early estimates suggest 50% Multi-Market, 10% Gateway, 30% City and only 10% Last Touch.
Building features illustrate location-functionality trade-off along the supply chain
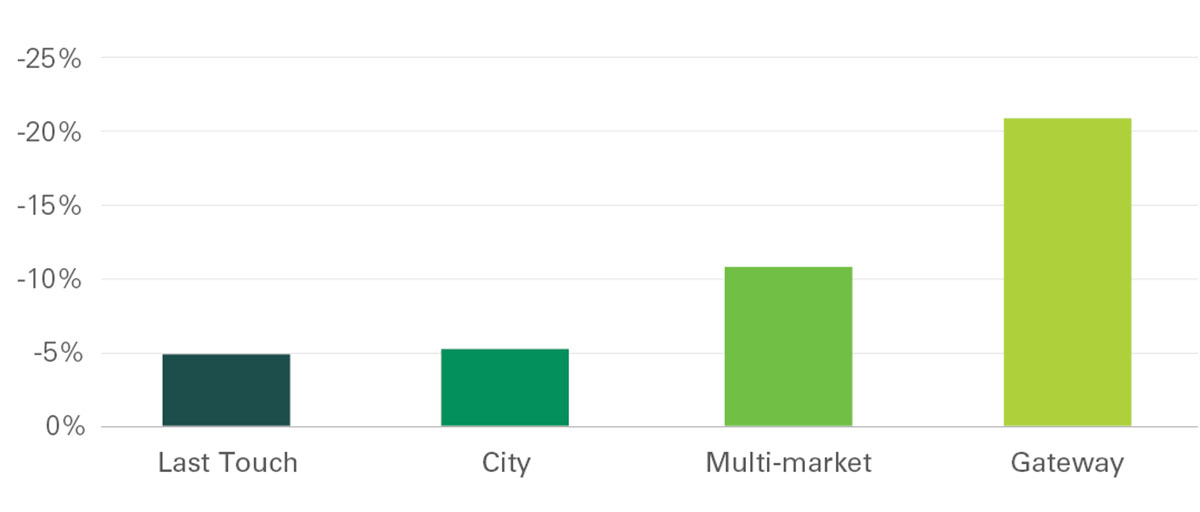
Last Touch facilities tend to be older buildings with smaller footprints, lower clear heights, tighter column spacing, fewer doors and less parking [see Exhibits 9-13], because these buildings were developed first. Whereas, Multi-Market facilities skew newer and larger, with higher clear heights, lower coverage ratios, larger column spacing, and more doors. Congestion risk, measured by comparing income reach within one-hour peak traffic to income reach within one-hour nonpeak traffic, is highest for Gateway and Multi-Market facilities [see Exhibit 14].
This model is designed to evolve alongside supply chains
The universe of logistics real estate users is highly diversified and underlying demand drivers are unique to each user; as a result, supply chains can be configured in a number of ways. This model is built to apply to the broadest driver of demand – consumption – yet it can be specialized by changing the underlying data to something more tailored. For example, a luxury retailer may be more interested in high-income households as a driver of demand. The model can also evolve over time alongside modern supply chain practices: More markets can qualify for higher service levels; drive times can be shortened; and building features can become more/less important. And, naturally, underlying income data and drive time radii will reflect the growth and change of cities. However, the typical location of Last Touch, City, Multi-Market and Gateway distribution buildings should evolve gradually over time, giving these categories staying power as a language to differentiate the various types of logistics real estate.
Exhibit 9
AVERAGE BUILDING AGE BY CATEGORY
(Years)
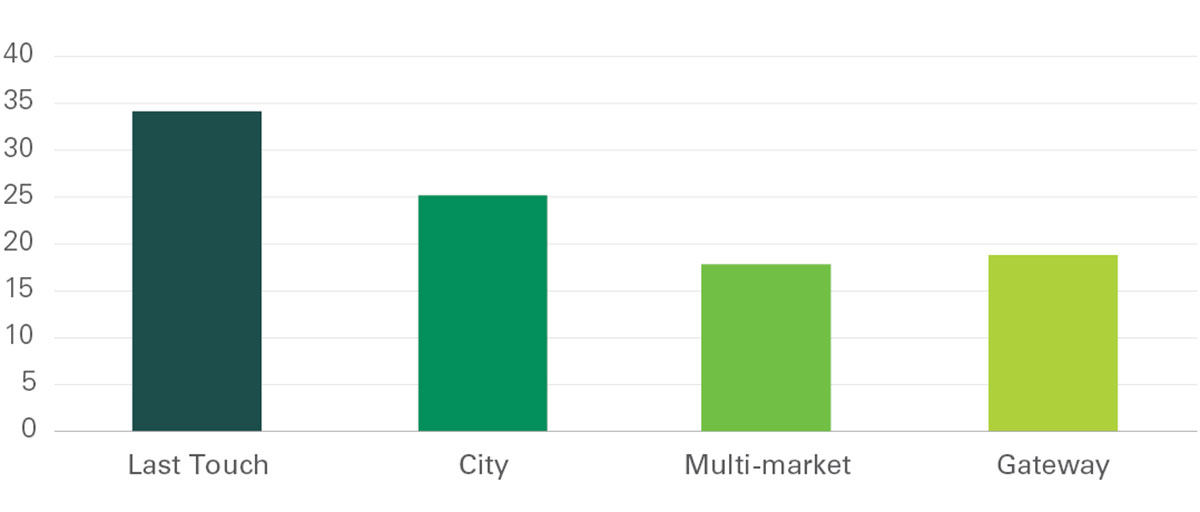
Exhibit 10
AVERAGE BUILDING SIZE BY CATEGORY
(SF)
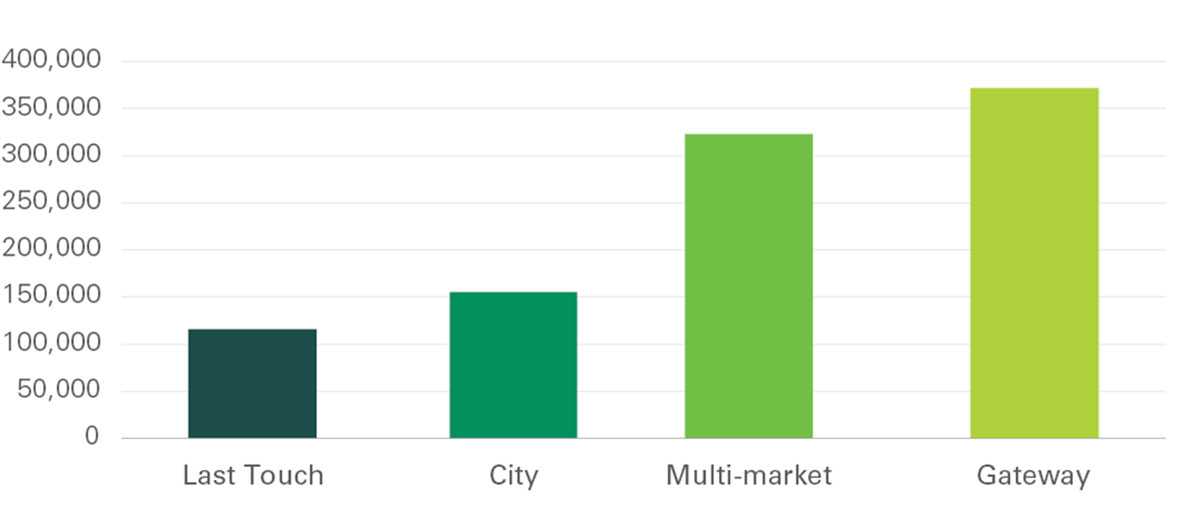
Exhibit 11
AVERAGE BUILDING CLEAR HEIGHT BY CATEGORY
(Ft)
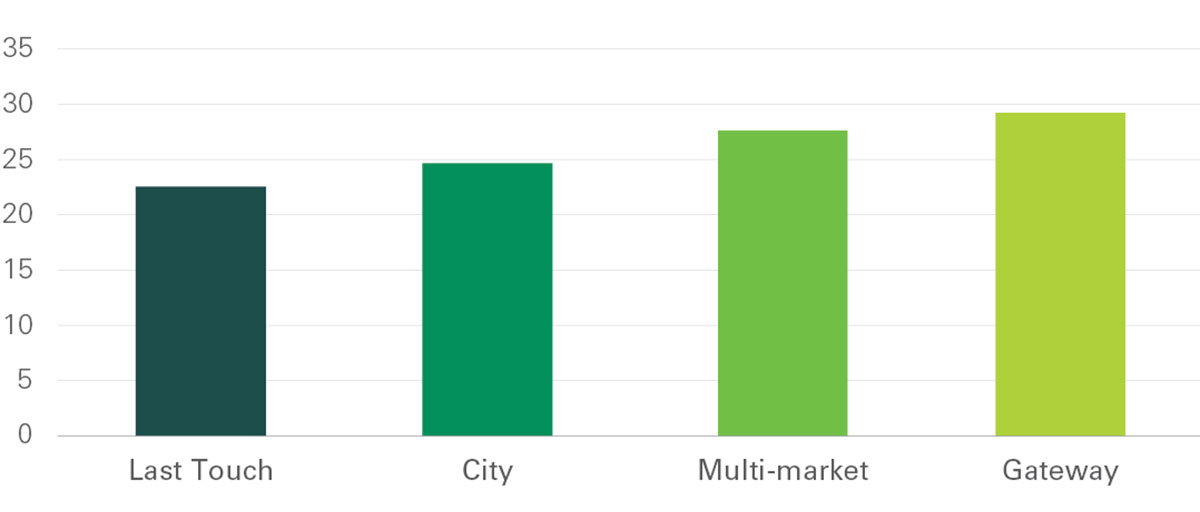
Exhibit 12
AVERAGE TRAILER PARKING SPACES BY CATEGORY
(#)
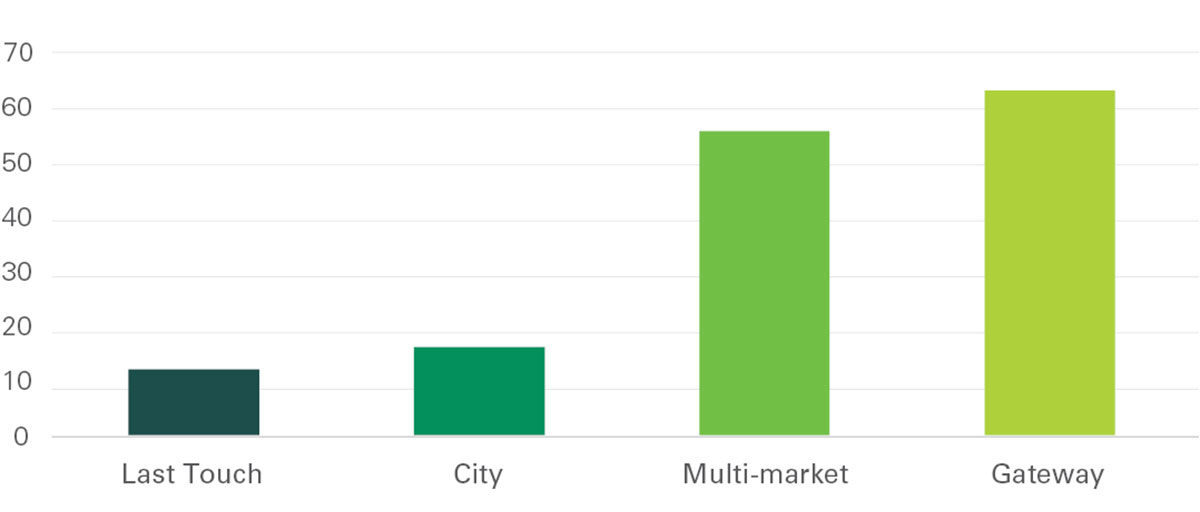
Exhibit 13
AVERAGE COLUMN SPACING BY CATEGORY
(Ft)
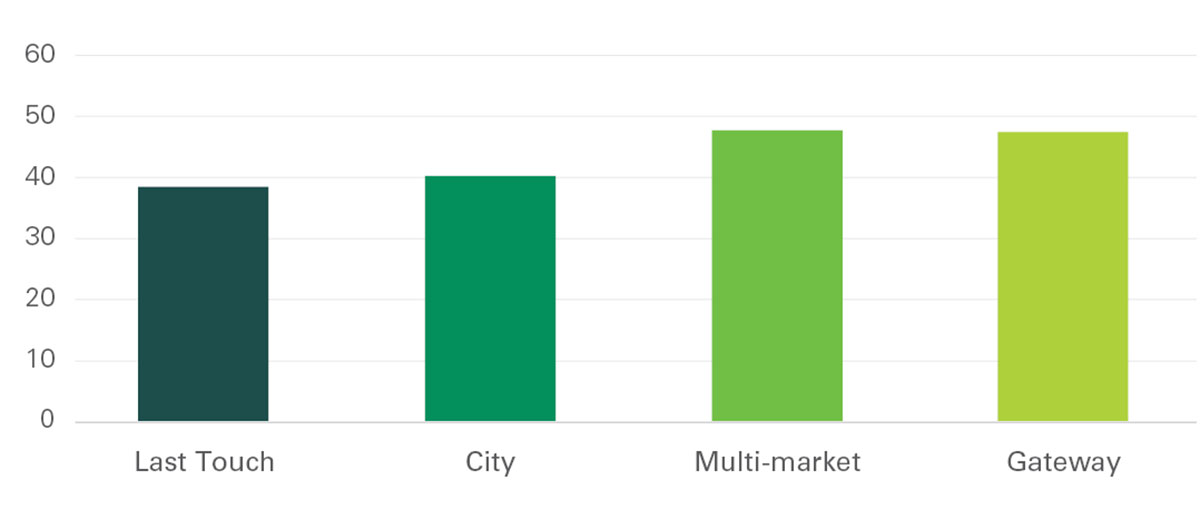
Exhibit 14
CONGESTION RISK BY CATEGORY
(% of income reach lost in peak traffic)
Appendix
Appendix 1
INCOME REACH FROM CITY CENTER
Appendix 2
MAJOR SEA AND INTERMODAL PORTS, U.S.
Endnotes
- Last Touch® is a registered trademark of Prologis
- Drive times generated by ESRI; income at zip code level from 2013-2017 American Community Survey, U.S. Census.
- Significance of Income Reach Score determined using a logistic regression of market rents, which a p-value of <.00001 after adjusting for market income and building size. Cut-offs were determined using a classification tree model based on an index of market rents, as a proxy for the value of space to its user. The higher the urgency, the higher the value.
- Estimated at 400 miles, as ESRI limits drive-time radii to 5 hours
Forward-Looking Statements
This material should not be construed as an offer to sell or the solicitation of an offer to buy any security. We are not soliciting any action based on this material. It is for the general information of customers of Prologis.
This report is based, in part, on public information that we consider reliable, but we do not represent that it is accurate or complete, and it should not be relied on as such. No representation is given with respect to the accuracy or completeness of the information herein. Opinions expressed are our current opinions as of the date appearing on this report only. Prologis disclaims any and all liability relating to this report, including, without limitation, any express or implied representations or warranties for statements or errors contained in, or omissions from, this report.
Any estimates, projections or predictions given in this report are intended to be forward-looking statements. Although we believe that the expectations in such forward-looking statements are reasonable, we can give no assurance that any forward-looking statements will prove to be correct. Such estimates are subject to actual known and unknown risks, uncertainties and other factors that could cause actual results to differ materially from those projected. These forwardlooking statements speak only as of the date of this report. We expressly disclaim any obligation or undertaking to update or revise any forward-looking statement contained herein to reflect any change in our expectations or any change in circumstances upon which such statement is based.
No part of this material may be (i) copied, photocopied or duplicated in any form by any means or (ii) redistributed without the prior written consent of Prologis.
About Prologis Research
Prologis’ Research department studies fundamental and investment trends and Prologis’ customers’ needs to assist in identifying opportunities and avoiding risk across four continents. The team contributes to investment decisions and long-term strategic initiatives, in addition to publishing white papers and other research reports. Prologis publishes research on the market dynamics impacting Prologis’ customers’ businesses, including global supply chain issues and developments in the logistics and real estate industries. Prologis’ dedicated research team works collaboratively with all company departments to help guide Prologis’ market entry, expansion, acquisition and development strategies.
About Prologis
Prologis, Inc. is the global leader in logistics real estate with a focus on high-barrier, high-growth markets. As of September 30, 2019, the company owned or had investments in, on a wholly owned basis or through co-investment ventures, properties and development projects expected to total approximately 797 million square feet (74 million square meters) in 19 countries. Prologis leases modern logistics facilities to a diverse base of approximately 5,100 customers principally across two major categories: business-to-business and retail/online fulfillment.
