AN EXTENDED RENTAL RATE EXPANSION
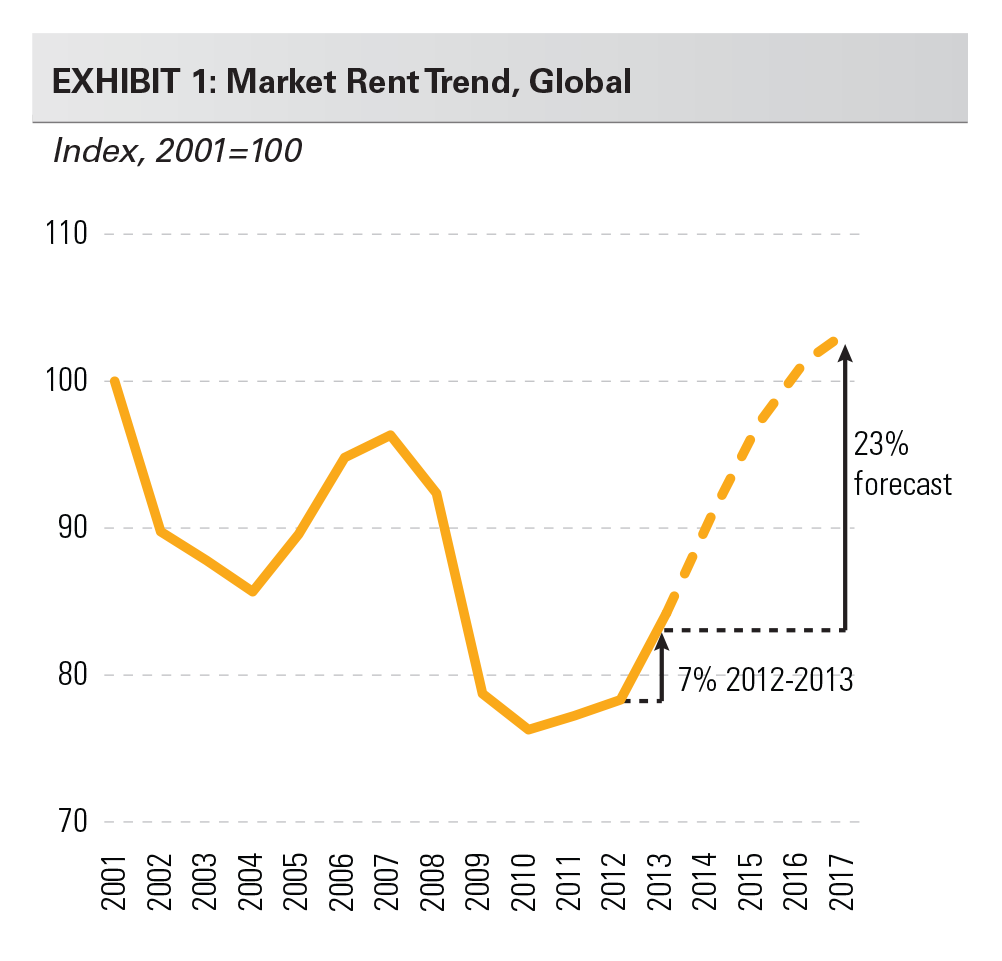
An extended rent growth cycle is emerging. We estimate worldwide rents for logistics facilities will grow by more than 5% per year from 2014 to 2017 (Exhibit 1). It is reasonable to assume that the steep decline in rents during the global financial crisis would be followed by a similarly strong recovery. However, our outlook is underpinned by the trend in structural drivers of logistics real estate in addition to the recovery in operating fundamentals, which together support stronger pricing power.
Looking back, rent increases during the mid- 2000s were limited by development relatively early in the cycle. Recall that this was a period of declining cap rates. Our analysis shows that the rents required to justify new construction were mostly flat during the 1998-2007 period as a result. As initial yield requirements declined, developers were able to justify new projects despite increases in construction costs and land values. Thus, projects met financial underwriting without any increase in market rents. As we look forward, we expect replacement costs will rise and return to their inflation trend, and that cap rates will be stable in most of the markets in which we operate.
PROLOGIS’ APPROACH TO FORECASTING RENTS
Rent forecasting is notoriously difficult. Rents are influenced by many factors, making forecasting a multifaceted, complicated process. Historically, data availability has been limited. Asking rents, as opposed to taking rents net of concessions, have typically been all that were available to industry researchers. What’s more, asking rents are infrequently updated, so they show a smooth trend that doesn’t match the volatility observed within the leasing markets. The typical approach to projecting rents emphasizes correlations to vacancy, ignoring trends in structural drivers such as construction costs, land values and cap rates. These structural factors are the foundation of our rent forecasting approach. They drive the development business and together define the financial opportunity of delivering new supply to the market. We combine these drivers together and estimate the rent required to warrant new development, which we refer to as “replacement cost rents.” As changes in the underlying drivers occur from year to year, replacement cost rents rise or fall accordingly. These changes are critical to understanding the potential for headwinds or tailwinds for rent growth within the industry.
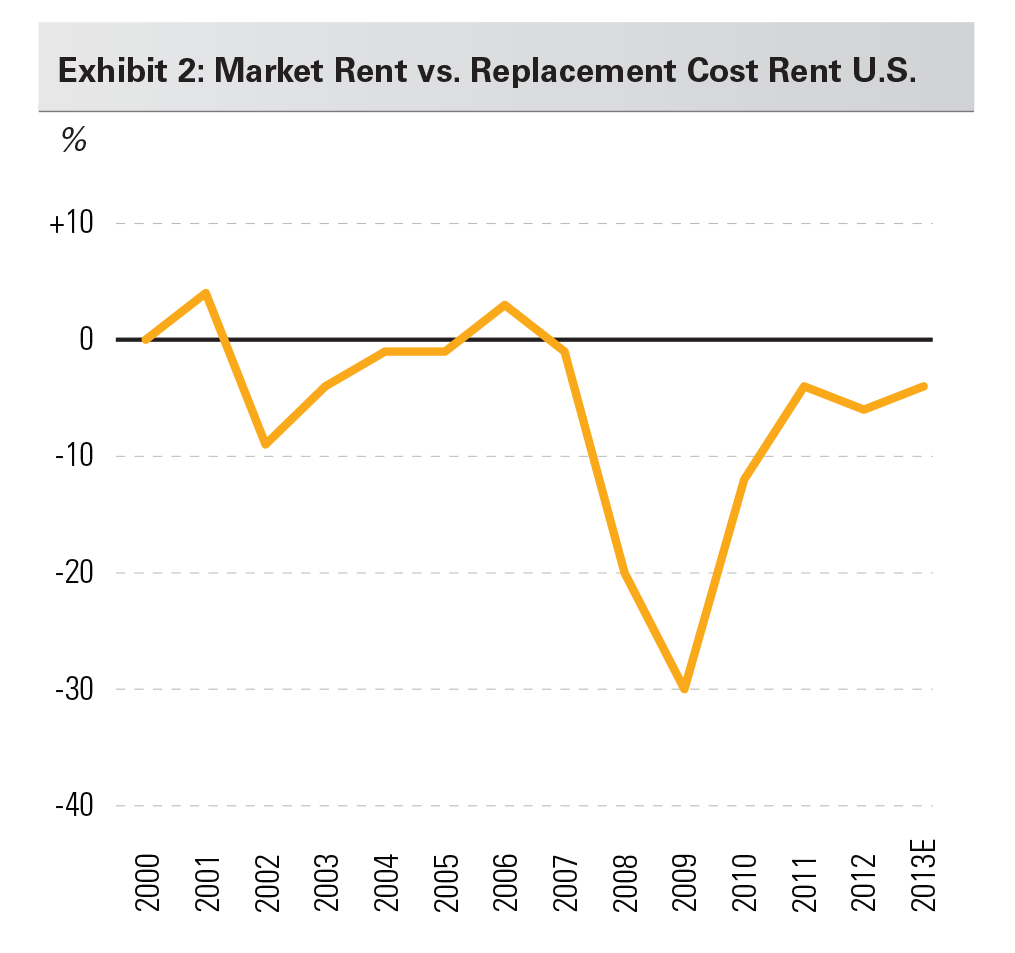
Operating fundamentals and vacancies are also critical to driving rents and are the second component to our rent forecasting. Market rents have historically tracked replacement cost rents, but with deviations based upon vacancy conditions. Therefore, we track market rents versus replacement cost rents and project the ratio forward based upon our forecast for vacancy rates (Exhibit 2). This component of the forecast is important to capturing short-term fluctuations in market rents as operating conditions evolve, and is consistent with the conventional approach of projecting rents.
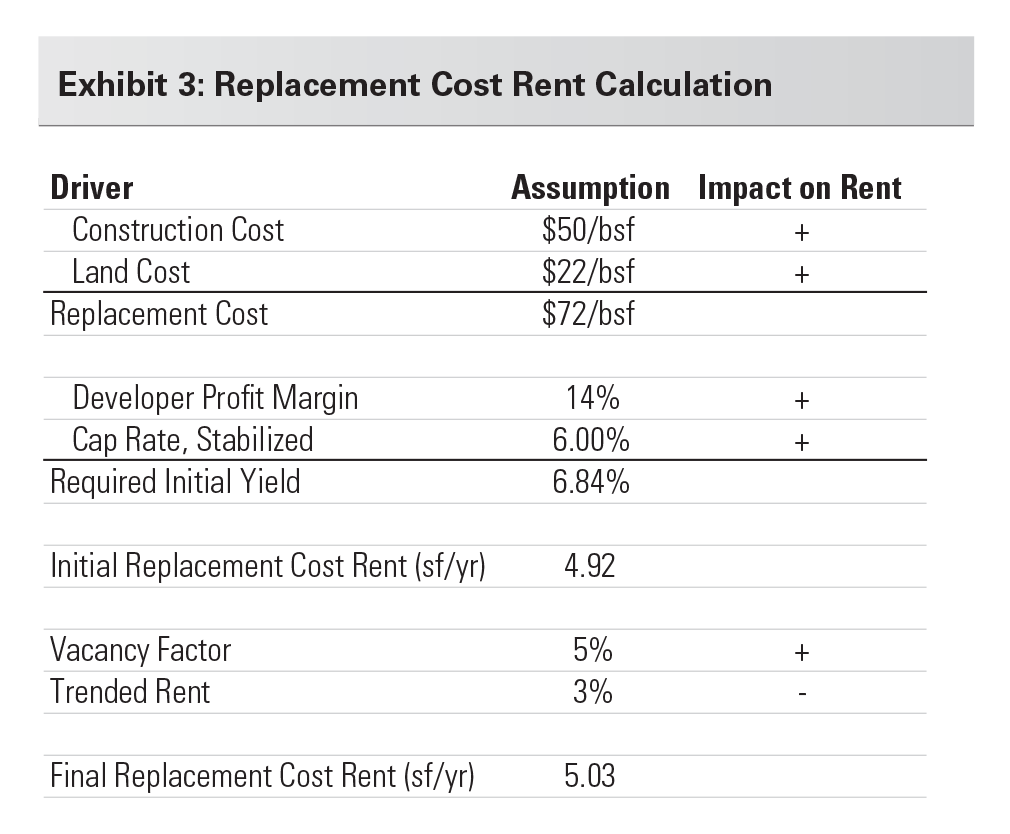
Replacement cost rents are primarily a function of four inputs: 1) construction costs; 2) land values; 3) cap rates; and 4) developer profit margins. We combine them to calculate the rent level that warrants new construction. Replacement costs (land and construction costs) are multiplied by a developer’s required return on cost (market cap rate and developer profit margin). We see notable fluctuations from year to year and over time in cap rates, construction costs and land values, but less volatility in developer margins.
We also include other assumptions that have a smaller impact on the replacement cost rent and show less volatility over time (see illustration below). These are: 1) developers’ assumed pro forma vacancy factor; and 2) the trended market rent growth assumption (e.g., underwritten market rent growth between the construction start and lease signing, which is particularly important in high-growth emerging markets). The higher the assumed vacancy factor, the higher the required replacement cost rent. In contrast, the stronger the trended rent growth assumption, the lower replacement rents need to be today to warrant construction.
REPLACEMENT COST RENTS EXPLAIN MARKET RENT TRENDS
Identifying trends in replacement cost rents have historically been hindered by a lack of data surrounding land values and construction costs. We created a database back to 1998 based upon proprietary and industry cost indexes and Prologis’ internal development data of 1,100 projects over 12 years (2001-2013). Historical land values were used and coupled with historical trends in asset values. Collectively, this data creates a replacement cost series that is consistent over time and adjusts for shifts in market mix that occur within our in-house development projects data.
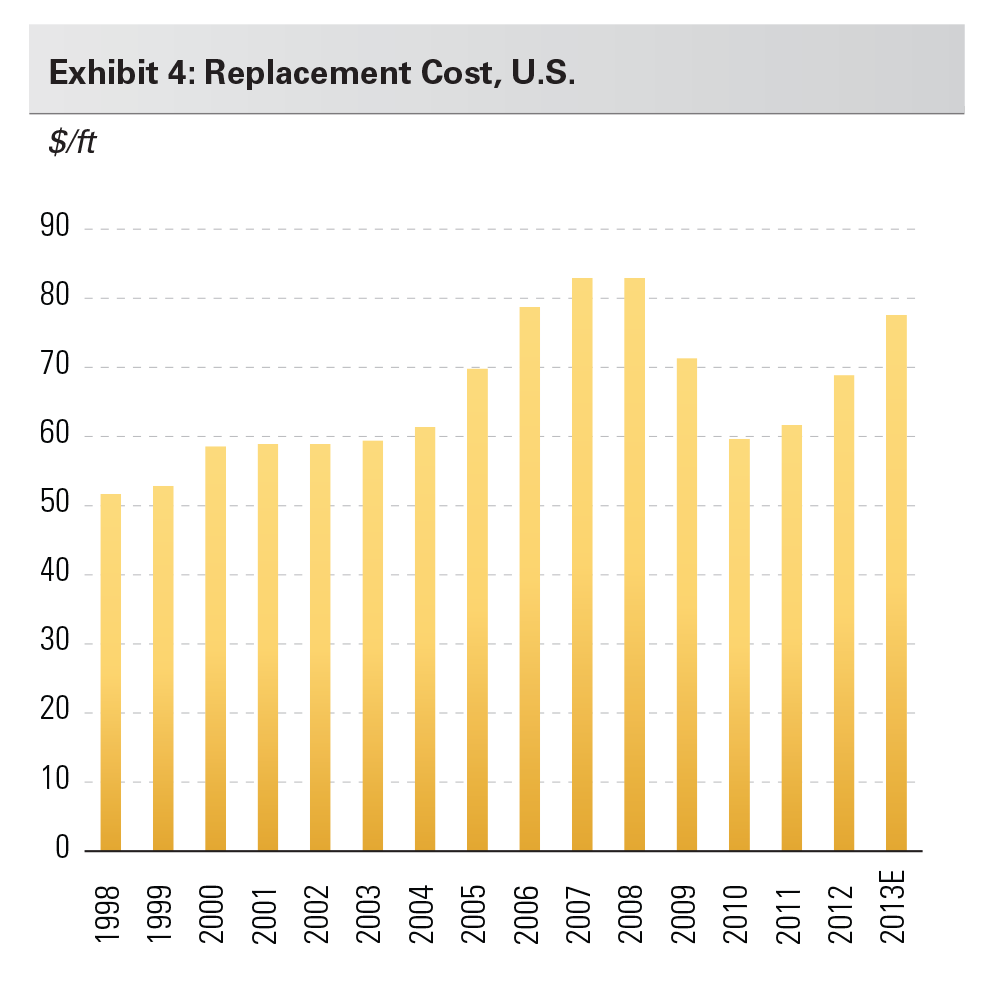
Despite the upward movement in costs, replacement cost rents have been mostly flat during the 15 years from 1998 to 2012. Construction and land costs rose appreciably during the prior economic expansion, from $50/ft to $80/ft. However, cap rate declines offset nearly all of the development cost increases, which would have otherwise led to higher replacement cost rents and lower construction volumes. Stabilized cap rates of 8.5-9.0% were the norm during the 1990s, and compressed to below 6% by 2007 (and today), a decline of more than 33%. With these competing factors taken together, replacement cost rents have been mostly flat since 1998 but for a temporary spike in 2008/2009 and a brief trough in 2011/2012.
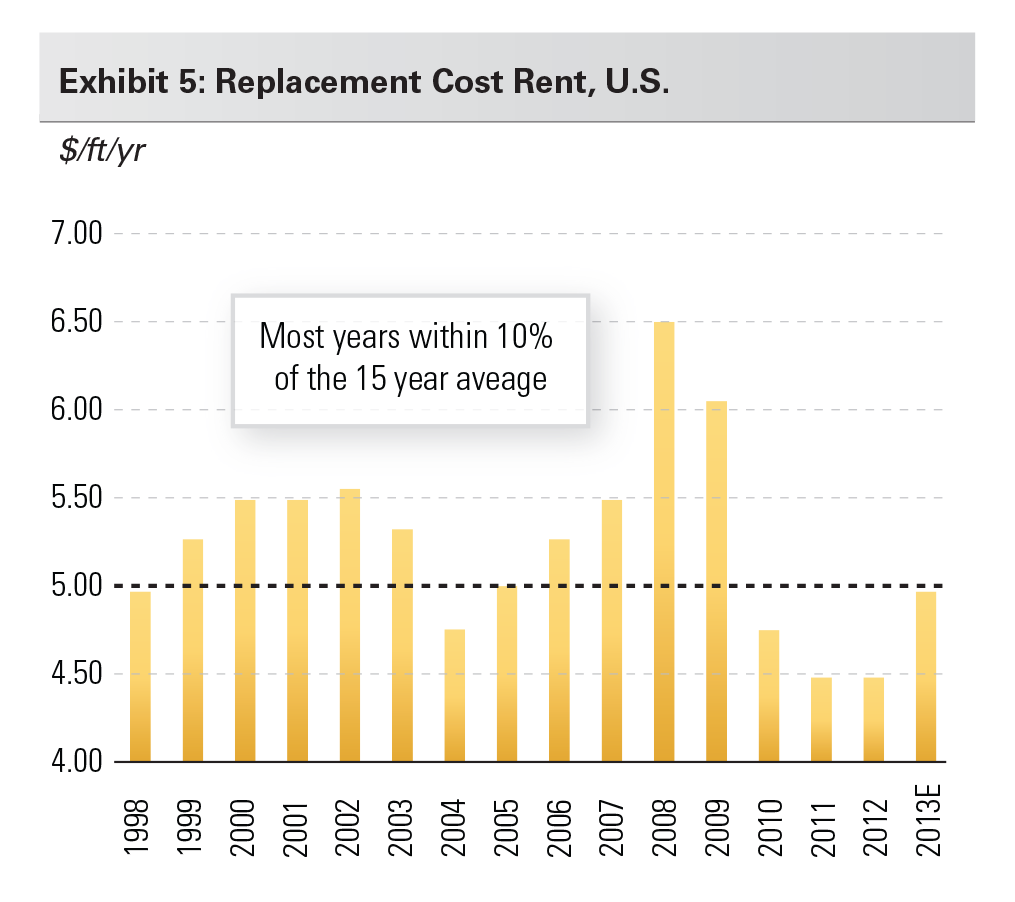
Market rents didn’t rise materially due to replacement cost rent dynamics. Consider the development market dynamics; construction costs were rising but required initial yields were declining. For much of the 1998-2007 period, developers were able to justify new projects at the same market rent level, and sometimes lower, despite cost increases (Exhibit 6). Effectively, these higher costs didn’t need to be passed through to the marketplace due to falling initial return requirements.
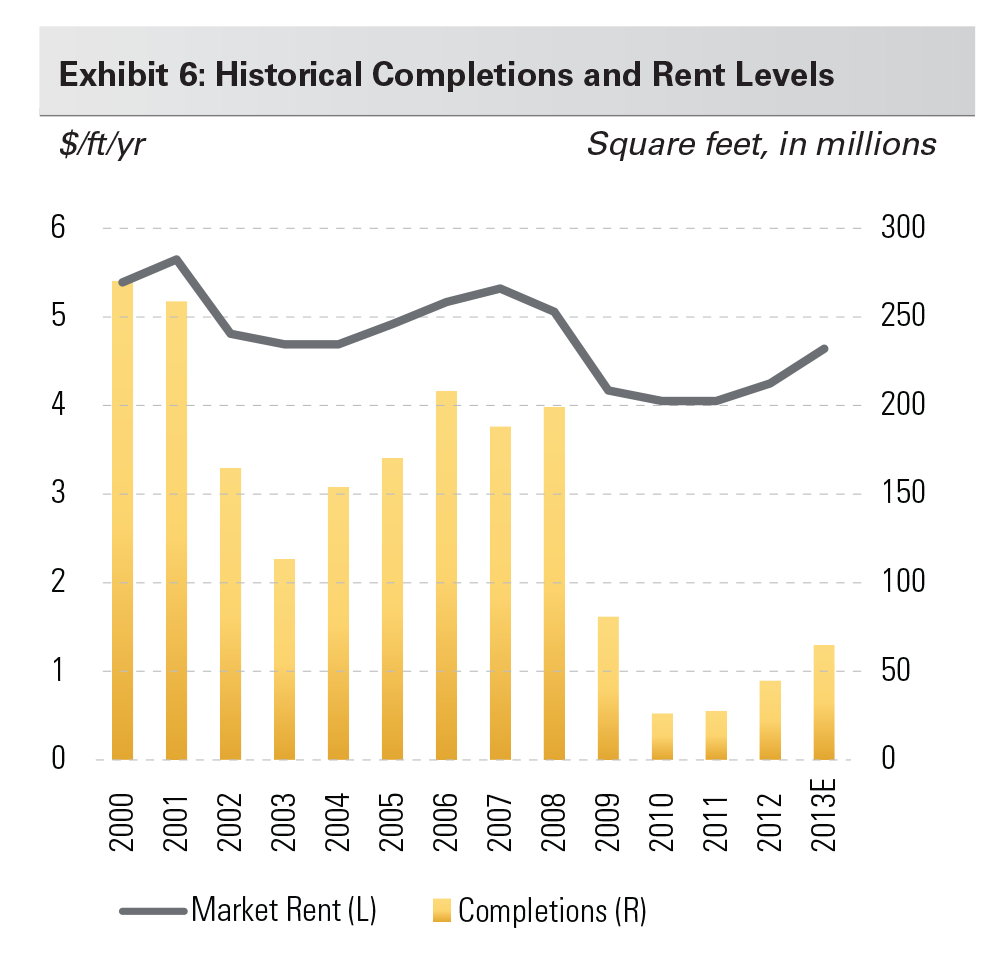
FORECASTING MARKET RENT GROWTH AROUND THE WORLD
Our forecast method is based upon a handful of assumptions by region:
- Growth of replacement cost, which is a function of the general trend in inflation and changes in industry-specific costs, including labor, commodity costs, land and general contractor pricing
- The trend of cap rates, which reduce replacement cost rents when they decline
- The differential between market rents and replacement cost rents, which we can observe today and trend forward based upon our outlook for vacancies
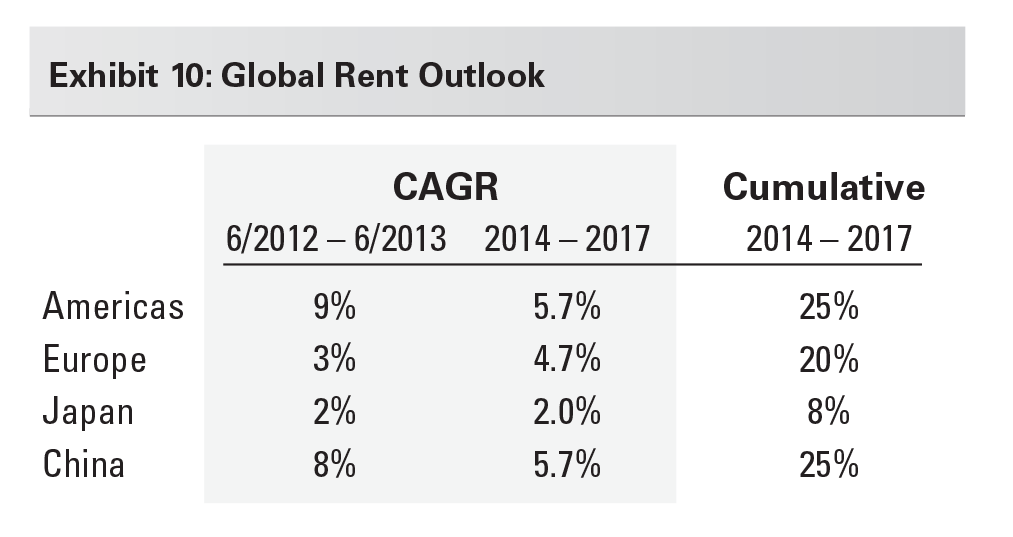
Our forecast for effective market rent growth is 20-25% globally during the four-year period between 2014-2017. This outlook is driven by our above-consensus expectations for operating conditions in the U.S. and Europe. Our expectations in Latin America, Japan and China are comparable to current consensus expectations in our view.
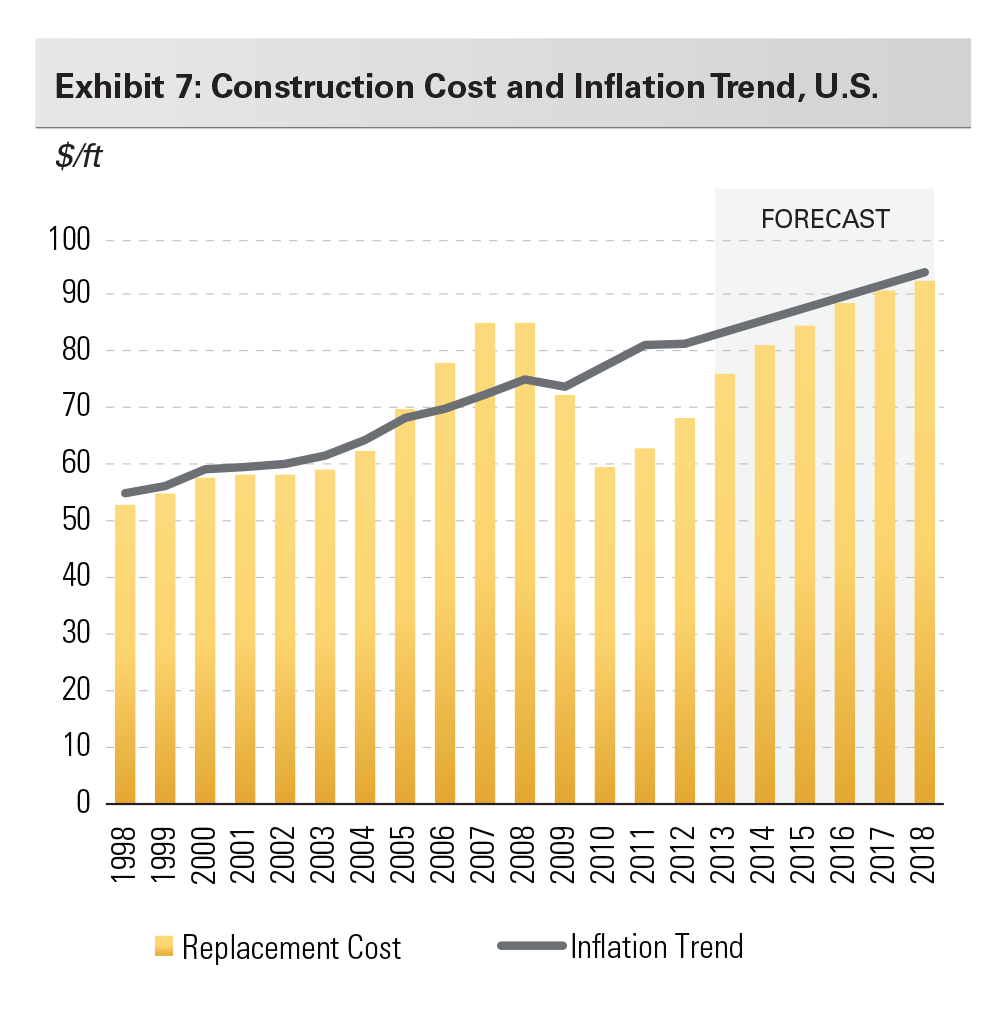
The outlook for replacement costs is critical to our forecasting approach, particularly in Prologis’ cyclical recovery markets (i.e., U.S. and Europe) where costs are currently depressed. Our method is underpinned by a return of replacement costs to the trend of general inflation, as shown for the U.S. in Exhibit 7. During the prior economic boom, replacement costs rose above the trend due to outsized increases in land and commodities. The subsequent bust resulted in replacement costs well below the inflation trend. Today we find costs to be 10-15% below this trend (we estimate 10% below by year-end 2013). We attribute much of the needed catch-up to a return in pricing power for general contractors (GCs). Pricing competition among GCs has led them to operate for very limited profit margins during the economic recession and recent recovery. Going forward, much of the return to the inflation trend will be driven by stronger pricing power and a return of profit margins for GCs.
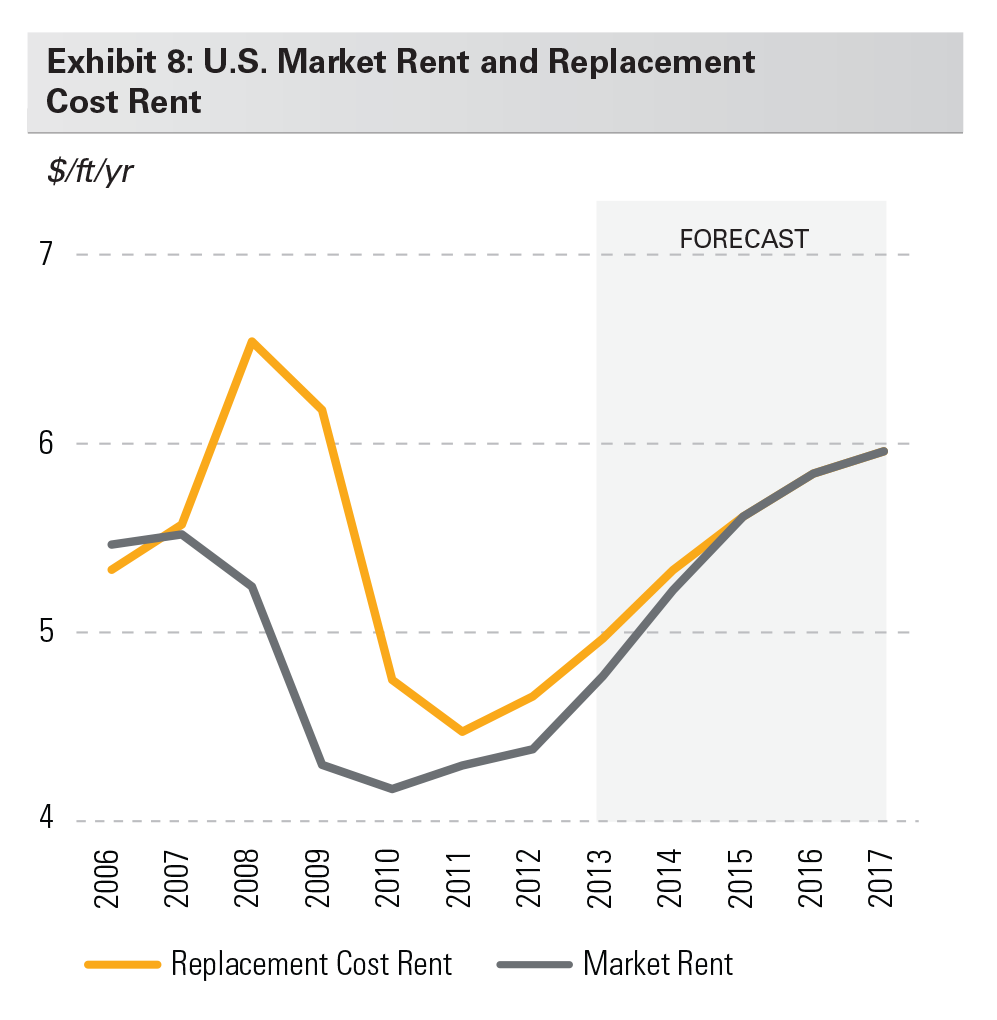
We expect outsized growth in the U.S. Market rents are up 9% in the last year and a total of 15% from the market trough reached in 2010 (Exhibit 8). We anticipate they can rise by 25% (5.7% CAGR) during our four-year forecast period, and our outlook depends upon the following:
- Replacement costs. We anticipate a 20% increase driven by two factors. First, the general trend of inflation should add 8% to costs (2% per year). Second, we find current replacement costs are more than 10% below their trend of general inflation, which have still not recovered from the global financial crisis and recession. The largest driver of an increase back to the general inflation trend will be the normalization of pricing and profit margins among general contractors, along with price increases for key inputs like land, steel and other commodities.
- Cap rates. In contrast with the historical precedent in which meaningful cap rate declines effectively eliminated the potential for increases to market rents, we expect nominal changes from current cap rate levels. However, if cap rates were to rise, our forecast for rent growth would increase accordingly.
- Market rents vs. replacement cost rents. Market rents are 5% below replacement cost rents, and we assume parity will be achieved. Market vacancies have already declined to 7.7%, according to CBRE, and we believe the demand/ supply imbalance will likely push vacancies below their low from the prior cycle (7.3%) within a year.
We also expect above consensus growth in Europe, which we estimate will amount to 20% during 2014-2017 (Exhibit 9). Rents troughed last year on an effective basis and are up 3% from a year ago. Although rents in Europe have reached an inflection point, the drivers and timing for growth are meaningfully different than in the U.S. Our assumptions are as follows:
- Replacement costs. As in the U.S., we forecast a 20% increase in replacement costs, and for the same reasons; general inflation is expected to contribute 8%, with the balance of the increase attributable to industry-specific cost increases, mainly general contractor pricing.
- Cap rates. Unlike the U.S., Europe has not witnessed recovery, and yield spreads are elevated relative to historic norms. We anticipate that stabilized cap rates can compress 50-100 basis points and underwrite 75 basis points in our forecast. This creates a headwind to rent growth of 12%, although it will be a positive for asset values.
- Market rents vs. replacement cost rents. Market rents are 13% below replacement cost rents, and we assume parity can be achieved. However, this may require the full forecast period given that the recovery of fundamentals in Europe has been gradual relative to the recovery in the U.S.
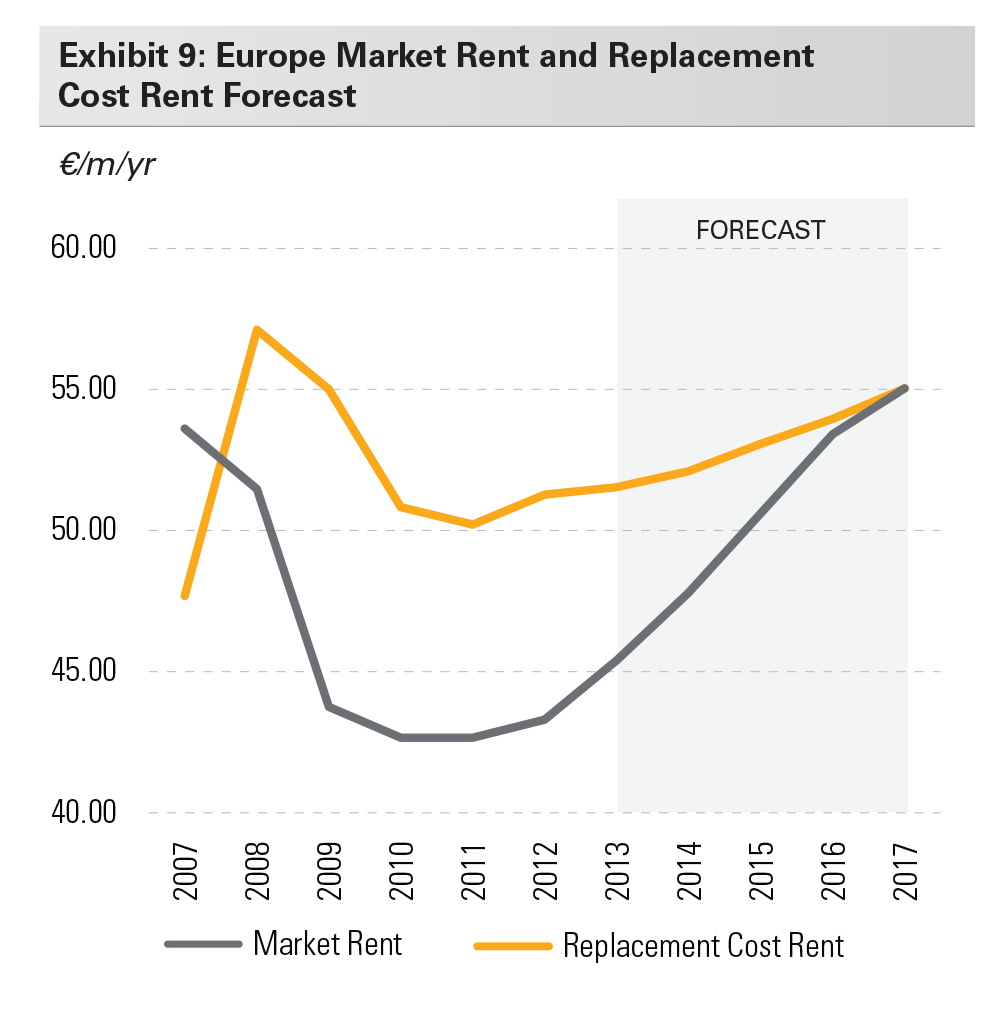
Exhibit 10 displays each of our forecasts around the world. In Japan, current market rents are above replacement cost rents, so our forecast is driven by construction cost increases (which are currently outsized due to the scarcity of skilled labor and development sites). In China and Brazil, we also find current market rents are modestly above replacement cost rents. Cap rates in these regions should be broadly stable at current levels, so these forecasts also depend upon the general trend in inflation. On the margin, we expect stronger pricing power due to very tight operating metrics in China and a higher inflation factor in Brazil.
CONCLUSION
Rent forecasting involves the consideration of many components. Rents in the largest markets, the U.S. and Europe, do not yet support broad based construction and rents will continue to increase. Structural drivers such as construction costs, land values and cap rates must be weighed against cyclical vacancy trends to determine rent growth. As replacement costs rise as the global economic expansion takes hold, we expect the rent required to justify new construction to rise in kind. This dynamic should limit the pace of new development, leading to an extended period of pronounced rent increases, particularly in our cyclical recovery markets in the U.S. and Europe. We expect stronger pricing power due to very tight operating metrics in China and a higher inflation factor in Brazil.
Forward-Looking Statements
Copyright © 2013 by Prologis, Inc. All rights reserved.
This material should not be construed as an offer to sell or the solicitation of an offer to buy any security. We are not soliciting any action based on this material. It is for the general information of customers of Prologis.
This report is based, in part, on public information that we consider reliable, but we do not represent that it is accurate or complete, and it should not be relied on as such. No representation is given with respect to the accuracy or completeness of the information herein. Opinions expressed are our current opinions as of the date appearing on this report only. Prologis disclaims any and all liability relating to this report, including, without limitation, any express or implied representations or warranties for statements or errors contained in, or omissions from, this report.
Any estimates, projections or predictions given in this report are intended to be forward-looking statements. Although we believe that the expectations in such forward-looking statements are reasonable, we can give no assurance that any forward-looking statements will prove to be correct. Such estimates are subject to actual known and unknown risks, uncertainties and other factors that could cause actual results to differ materially from those projected. These forward-looking statements speak only as of the date of this report. We expressly disclaim any obligation or undertaking to update or revise any forward-looking statement contained herein to reflect any change in our expectations or any change in circumstances upon which such statement is based.
No part of this material may be (i) copied, photocopied, or duplicated in any form by any means or (ii) redistributed without the prior written consent of Prologis.
About Prologis
Prologis, Inc., is the leading owner, operator and developer of industrial real estate, focused on global and regional markets across the Americas, Europe and Asia. As of June 30, 2013, Prologis, Inc. owned or had investments in, on a wholly owned basis or through co-investment ventures, properties and development projects expected to total approximately 563 million square feet (52.3 million square meters) in 21 countries. The company leases modern distribution facilities to more than 4,500 customers, including manufacturers, retailers, transportation companies, third-party logistics providers and other enterprises.
White Paper Contributors
Chris Caton, Vice President – Research
Dave Twist, Vice President – Research
Audrey Symes, Manager – Research
Michael Steingold, Analyst – Research
