The industrial real estate landscape is changing as technology advances and consumers demand faster delivery of goods. These trends have a profound impact on demand, as several percent of industrial real estate is rendered obsolete in the U.S. every year; that percentage is even higher in Japan and Europe. Obsolescence is principally a reduction in supply: Each year a portion of the market is no longer attractive to logistics users. The need to replace aging stock should drive a significant volume of new development against a backdrop of historically low vacancies. Here we examine:
- classifications and drivers of obsolescence
- obsolescence in Japan and Europe
- obsolescence in the United States
I. Classifying Obsolescence
Logistics facilities experience three types of obsolescence: locational, functional and economic. Locational obsolescence refers to users’ preferred locations. Today’s supply chains are increasingly global. This means competitive positioning must involve having the right quantity at the right location at the right time. A well-located property can access population centers, suppliers, transit infrastructure and labor. Of note, changes in transportation infrastructure, such as a highway expansion, can create obsolescence. As cities grow, the value of locations can improve, extending the asset’s useful life and creating upzoning and better opportunities for use.
Functional obsolescence is the inability of a property to meet changing customer requirements in light of supply chain advances. Examples include truck parking and maneuvering needs (e.g., the coverage ratio); higher ceiling heights and increased dock door counts to accommodate equipment and the flow of goods; or, simply, building size.
Economic obsolescence refers to changes in a property’s financial profile. Urbanization pressures and the opportunity for higher and better use create opportunities to repurpose existing logistics facilities—for example, into office space or multifamily buildings, as the underlying value of the land increasing from demand from alternative users. Alternatively, economic obsolescence may also include a mismatch in the rental rate a property can command relative to ongoing operating and capital expenses, making the facility no longer financially viable.
User type affects the rate of obsolescence. In the case of bulk distribution facilities, new properties will meet—and often exceed—prevailing customer requirements. Typically, major national/international distributors need the most modern features to accommodate high velocity and volume. In time, parameters evolve and the facility may become workable only for smaller-scale regional/local customers. As the property ages, additional use cases such as light industrial and other small business operations continue nevertheless. This evolution can be illustrated by a theoretical demand curve as a property ages, shown below. Of note, requirements vary substantially by market, industry type and distribution activity.

These use cases illustrate the interplay of functional and locational obsolescence. Importantly, they reveal the pace of obsolescence over time, which differs widely based on choices by the end users.
- National/International Distribution. These customers require highly functional properties to process a high volume of goods every day. They maximize the number of dock doors, ceiling heights and lower coverage ratios for truck parking. Location is also critically important for supply chain models that focus on broad distribution which minimizes transportation costs. Typically these customers favor access to transportation infrastructure— ports, airports, intermodal facilities, major highways and other nodes—versus close-in specific submarkets or micro locations. Lower traffic congestion can also be a positive factor.
- Local/Regional Distribution. These customers balance functional and locational requirements. Their supply chain solves for distribution to a smaller region, thus the submarket or other micro location within a market is more important. While functionality is a factor, customers usually can adapt to second-generation facilities.
- Light Industrial. Location is crucial to these users. Proximity to customers, suppliers and labor is key. Often, they search for a micro location within a submarket, seeking the most functional available property. Typically, these customers can modify their requirements to match what’s available.
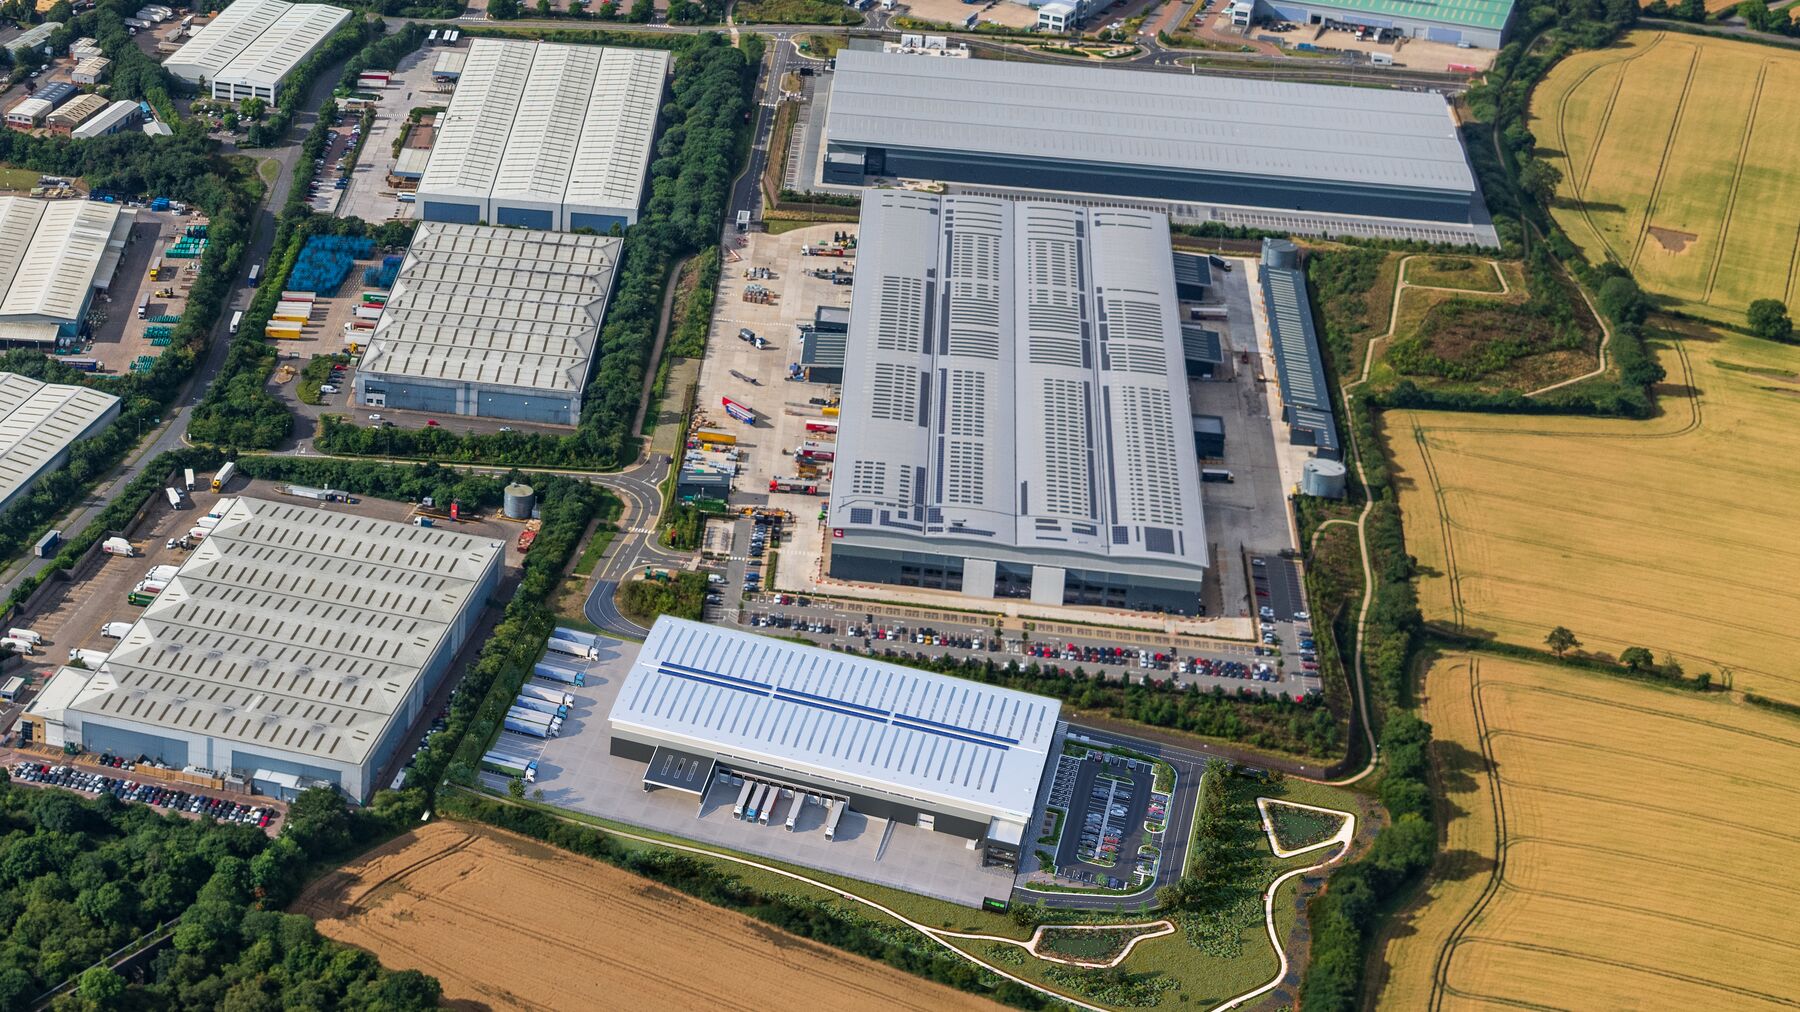
Tracking the Evolution of Requirements for Major Distributors Prologis Park I-75, McDonough, GA, USA

Obsolescence drives risks and opportunities in industrial real estate.
- A poorly located property or one with substandard features will have difficulty attracting customers over its useful life. In time, properties can become harder to lease if they have functional and/or locational challenges.
- On the opportunity side, users regularly upgrade, either from Class-C to Class-B or from Class-B to Class-A. “Flight to quality” creates long-term demand for Class-A properties, even during recessions.
The growth of cities over multiple decades means superior locations are a primary mitigating factor of obsolescence. In contrast, building features continue to evolve. For example, extended trailer parking and lower coverage ratios are now more common, but earlier vintage properties may be underserved. Ceiling height is a popular metric; while it is a driver of functional obsolescence, only a portion of national and regional distributors need maximum ceiling heights (above 30 feet), and fire code restrictions in some markets limit the benefit of further ceiling height growth. Asset longevity is helped by the greater presence of long-term developers/owners, which means building features and site layouts are designed not just for the first tenant, but also for second- and third-generation users.
Our research provides insight through the lens of region-specific activity. Our analysis in the following section focuses on major developed (mature) markets, including Japan, Europe and the U.S. For now, emerging markets are outside the scope of our analysis, as logistics facilities are being built up for the first time to satisfy new growth. Looking ahead, emerging markets may soon experience obsolescence given their rapid rate of city development and resulting urbanization pressures.
II. Obsolescence in Japan and Europe
The obsolescence rate in major developed markets is highest in Japan and Europe on a percentage of stock basis. The logistics market for modern institutional-grade real estate is still young in these regions, and consequently represents a low share of total industrial stock. In both markets, much of the marketplace is in functionally obsolete facilities. In Japan, early industrial stock served the domestic manufacturing industry. Manufacturing has for the most part moved offshore to lower-cost locations, contributing to a rise of imports as a share of total economic activity. Old industrial stock has become ill-equipped to serve the flow of goods. In Europe, a similar trend of global trade flows increased the importance of locations proximate to Europe’s ports. This trend coincided with the rise of the euro and the decline of trade barriers, allowing customers to approach Europe as one market versus 28 distinct countries.

These themes take time to play out. Even though Japanese imports have been expanding for more than a decade and the euro was created just as long ago, these themes still drive demand. Existing supply chains are based on legacy business practices. Today, many users are engaged in multi-year plans to upgrade and replace existing infrastructure. We explore each region in more detail below.
Japan’s institutional logistics market enjoys sizable structural demand growth as a result of obsolescence. The contrast between institutional and obsolete properties is stark. Older facilities tend to have small floor plates and, if they are multi-level, are served by elevators that can’t handle the volume of ramp access. Customers who use ramp-served facilities enjoy 20-30 percent operational cost savings relative to non-ramp-served facilities. The institutional logistics market totals 143 million square feet in Tokyo and Osaka, according to CBRE. This represents growth of nearly 200 percent from 2006 to 2014, when annual deliveries averaged 12.6 million square feet. This growth is significant compared with the growth of the economy; annual GDP growth averaged just 0.4 percent in the same time frame. Development will be driven by low market vacancies, which was 2 percent in Tokyo and 0.4 percent in Osaka as of the fourth quarter of 2014, according to CBRE.

In Europe, upgrades from obsolete properties are an important structural driver of demand. We estimate the size of the institutional logistics market to be 1.4 billion square feet, roughly 15 percent of total industrial stock. Net absorption averaged 45 million square feet during the past five years, remaining above 20 million square feet even during the weakest year. To compare, annual GDP growth has averaged just 1.0 percent, revealing that logistics can benefit without GDP growth. Trade has been significantly stronger, rising more than 50 percent in the past decade, and new logistics facilities have been developed in key distribution nodes, either close to Northern European ports or in increasingly important inland distribution areas such as Lyon, the Midlands (U.K.) and Southern Poland. As a result, the European vacancy rate reached 7.2 percent as of the fourth quarter of 2014, below levels achieved in the last cycle according to data from Gerald Eve, CBRE, JLL and DTZ.
The share of modern/institutional logistics is estimated at 15% of the total inventory. This average varies significantly within Europe. The vast majority of stock in CEE is built in the past decade, leading to a low functional obsolescence ratio. The share of modern logistics stock in a number of well-established market in Western Europe (like Rotterdam, Munich and London) is much lower. These markets have a long-term reputation as a trade hub and are infill locations with limited land.

III. Obsolescence in the U.S.
In the U.S., the maturity of the real estate market requires a complex analysis of obsolescence. This maturity creates a unique interplay between locational and functional obsolescence. Looking back more than 30 years, logistics facilities were already being constructed to serve national distribution, and many are still usable. Obsolescence in the U.S. prompts two themes:
- Complex analysis. The difference between institutional-grade and obsolete properties is more subtle than elsewhere in the world due to its legacy of domestic affluence and higher building standards.
- Quantifying obsolescence. Disentangling growth between market expansion and upgrades to institutional-grade logistics stock makes it even more challenging to measure how many properties become obsolete each year.
Measuring tear-downs is one way to estimate obsolescence, but this approach doesn’t capture the true rate at which properties become obsolete. Scrappage occurs for a variety of reasons, including higher and better use, Class-A upgrades and infrastructure improvements such as wider highways and interchange expansions. Yet, data on tear-downs is limited. We have taken a qualitative approach instead. Working with CBRE, we studied several representative markets, including Los Angeles, Seattle, Chicago, Dallas, Atlanta and New Jersey. Demolition rates in these markets equate to 15–35 basis points of total stock per year on average. If we apply this ratio to total U.S. market stock, we see annual demolitions upward of 50 million square feet. By comparison, total industrial completions totaled 200–300 million square feet per year during the last expansion. We estimate that tear-downs account for about a sixth of total new activity.
This scrappage rate likely underestimates the pace of obsolescence. Tear-downs focus mostly on Class-C properties that are already obsolete. A more precise estimate of obsolescence would study the rate at which institutional-grade properties age and leave the competitive pool, becoming Class-C properties and falling to alternative uses. However, this data has not been monitored closely. Instead, we base our estimate on a current snapshot of the market.
We use a few assumptions to estimate the obsolescence of institutional-quality assets. We divide the market into institutional-grade or obsolete product, and then estimate the rate at which properties fall out of the institutional-grade category. In the U.S., total industrial stock amounts to 19 billion square feet according to CoStar. To cull back the market size to just institutional grade, we make three adjustments. First, we exclude properties in smaller markets, which are far from transit infrastructure and major population centers, and accounts for 40% of total U.S. industrial stock. Next, within major logistics markets, nearly 25% of industrial stock is for non-logistics uses (e.g., manufacturing). And lastly, roughly 40% of industrial stock is comprised of obsolete properties. Taken together, these figures indicate roughly one-third of properties in major markets, or 20% across all of the U.S., are institutional-grade. The total institutional-grade logistics market amounts to approximately 4 billion square feet—a combination of Class-A bulk distribution properties and well-located Class-B properties.

Our estimate of the institutional market size is based on detailed research. Historically, it has been difficult to identify higher- and lower-quality properties within industrial real estate databases. It’s easier now thanks to new data from CoStar:
- Detailed property type. CoStar has carefully catalogued secondary industrial use (e.g., bulk distribution versus manufacturing).
- Property class. CoStar has supplemented broker-defined class with proprietary classifications (a five-star scale).

Allocating Class-A properties to the institutional group and Class-C properties to the obsolete group is straightforward. With Class-B properties, however, quality varies widely. Here, CoStar’s classification system is helpful. Among Class-B properties, 40 percent are designated 1- and 2-star and, on closer examination, have clear functional and locational challenges. Three-star Class-B properties tend to vary, but are more consistently functional. Collectively, we estimate 40 percent of industrial facilities in major markets are currently obsolete.
The U.S. obsolescence rate is in the range of 100 million square feet and functions as a reduction of stock, in our view. With the institutional market close to 4.0 billion square feet, we estimate the rate at which properties fall out of the institutional pool to be 80-150 million square feet per year. Average property lifespans are upward of 50 years or more but can be as short as 25 years for poorly located or configured properties. This suggests the obsolescence rate would be 2-4 percent. Our tear-down estimate is lower; it predominantly represents the tear-down of Class-C properties whereas obsolescence refers to the rate at which Class B+ assets transition toward Class-C status. Our estimate of obsolescence reveals that approximately half of new construction in the U.S. is meant to replace obsolete stock versus satisfy new growth.
Two additional considerations affect the U.S. obsolescence rate: It is poised to rise in the coming years and it varies across markets.
- Obsolescence rate to rise. Modern logistics properties today are likely older than ever before because users had to make do with their existing leased properties during the global financial crisis and subsequent lack of development during the recovery. Contributing to the age of modern properties is the historical peak timing of development, which occurred during the 1980s and 1970s to a lesser degree. Some of these properties are reaching the end of their functional lives and will become obsolete.
- Obsolescence rate varies by market. The composition of U.S. markets, either by customer type, building features (such as size), traffic congestion and drive times, or simply the availability of land, lead to vastly different rates of obsolescence. Infill markets, such as Northern New Jersey, Los Angeles or the San Francisco Bay Area, have slower rates of obsolescence. These markets have unique rates of obsolescence, as their locations can improve and use may migrate from bulk distribution facilities to light industrial over time. The evolution of markets and migration of use acts as an offset to functional obsolescence, while at the same time also experience a higher rate economic obsolescence. In addition, infill areas with markets with lower supply constraints, such as by the O’Hare or DFW airports, also enjoy slower rates of obsolescence. By comparison, some markets with low barriers to supply or tax incentives that favor real estate incentives, such as Columbus, Indianapolis or Memphis, have higher rates of obsolescence.
Conclusion
Obsolescence is an important driver of industrial supply and demand. It plays a central role as the asset class expands in developed economies, as in Europe and Japan. In developed markets, increasing adoption of logistics brings more customers to institutional-grade facilities as they leave older, poorly configured properties. While the adoption of our asset class is strong in the U.S., aging properties create opportunities to replace old stock; this amounts to approximately 100 million square feet of total institutional stock annually. Of course, obsolescence also poses risks. Facilities in weaker locations— those neither in the path of growth nor near major population centers or with sub-standard site configurations, ceiling heights and other features— risk losing customers and growing capital expenditures. These trends play a smaller role in emerging markets that do not have a base of logistics stock. In the U.S., obsolescence reduces supply, which in turn must be replaced. In Europe and Japan, the modernization of the supply chain prompts demand. Ultimately, we see a sizable need for development as the structural driver of obsolescence coincides with low vacancies in many markets around the world.
Endnotes
- CoStar, Prologis Research
Forward-Looking Statements
Copyright © 2015 Prologis, Inc. All rights reserved.
This material should not be construed as an offer to sell or the solicitation of an offer to buy any security. We are not soliciting any action based on this material. It is for the general information of customers of Prologis.
This report is based, in part, on public information that we consider reliable, but we do not represent that it is accurate or complete, and it should not be relied on as such. No representation is given with respect to the accuracy or completeness of the information herein. Opinions expressed are our current opinions as of the date appearing on this report only. Prologis disclaims any and all liability relating to this report, including, without limitation, any express or implied representations or warranties for statements or errors contained in, or omissions from, this report.
Any estimates, projections or predictions given in this report are intended to be forward-looking statements. Although we believe that the expectations in such forward-looking statements are reasonable, we can give no assurance that any forward-looking statements will prove to be correct. Such estimates are subject to actual known and unknown risks, uncertainties and other factors that could cause actual results to differ materially from those projected. These forward-looking statements speak only as of the date of this report. We expressly disclaim any obligation or undertaking to update or revise any forward-looking statement contained herein to reflect any change in our expectations or any change in circumstances upon which such statement is based.
No part of this material may be copied, photocopied, or duplicated in any form by any means or redistributed without the prior written consent of Prologis.
About Prologis
Prologis, Inc., is the leading owner, operator and developer of industrial real estate, focused on global and regional markets across the Americas, Europe and Asia. As of September 30, 2014, Prologis owned or had investments in, on a consolidated basis or through unconsolidated joint ventures, properties and development projects totaling approximately 585 million square feet (54.3 million square meters) in 21 countries. The company leases modern distribution facilities to more than 4,700 customers, including manufacturers, retailers, transportation companies, third-party logistics providers and other enterprises.
Prologis Research
Prologis’ research department studies fundamental and investment trends and Prologis’ customers’ needs to assist in identifying opportunities and avoiding risk across four continents. The team contributes to investment decisions and long-term strategic initiatives, in addition to publishing White Papers and other research reports. Prologis publishes research on the market dynamics impacting Prologis’ customers’ businesses, including global supply chain issues and developments in the logistics and real estate industries. Prologis’ dedicated research team works collaboratively with all company departments to help guide Prologis’ market entry, expansion, acquisition and development strategies.