Introduction 

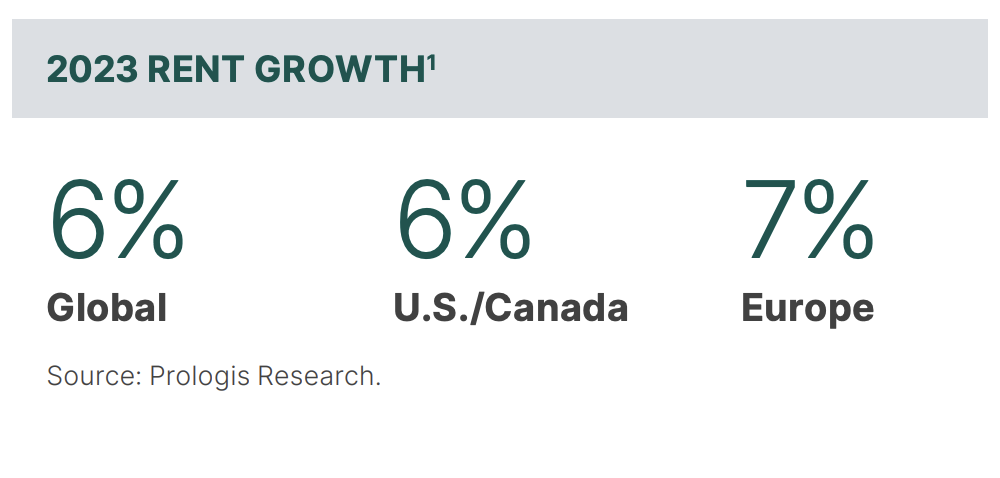
Global logistics real estate rent growth totaled 6% in 2023, underscoring the resilience of logistics real estate fundamentals. Nearly all markets globally recorded positive real rent growth, amid positive demand, low vacancy, and the need to evolve supply chains in response to changing consumer expectations, operational challenges and persistent disruption. 

The Prologis Logistics Rent Index combines our expert local market insights and proprietary data to examine net effective rental growth1 trends across markets in North America, Europe, Asia, and Latin America. Rental rates at the regional and global levels are weighted averages based on estimates of market revenue (market stock multiplied by market rental rate).

2023 rent index growth chart

Exhibit 1:

Takeaways

  • Latin America led the world as Mexico rents surged 19%, driven by ultra-low vacancy, rapidly rising replacement costs, and the emergence of nearshoring, a new secular driver.
  • The majority of markets posted positive real rent growth. Only a small handful of markets, either those that cooled from record levels of rent growth in 2021/2022 or had excess supply, pulled down global and regional averages in 2023.
  • Replacement costs increased in most regions during 2023, driven by higher costs for labor and materials, as well as higher interest rates. Replacement costs put upward pressure on rents and drove new construction starts down by more than two-thirds from peak levels globally

Global Trends and Outlook 

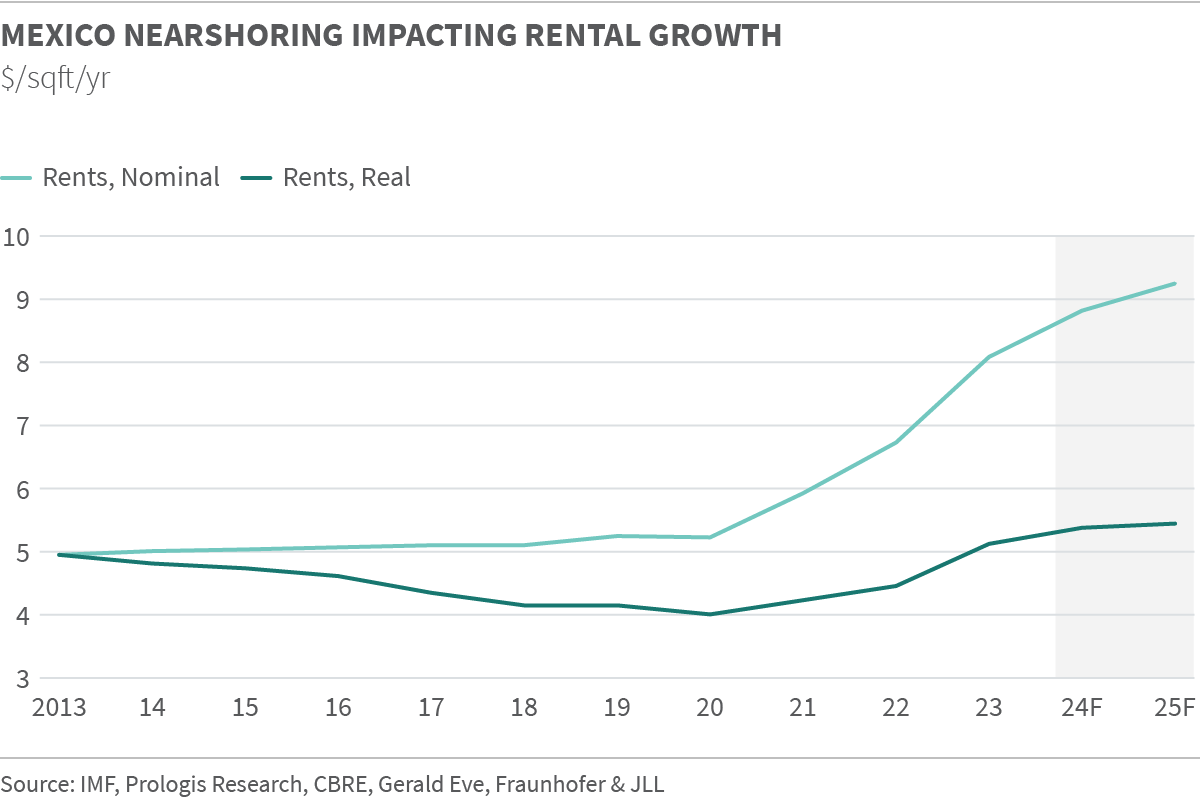
Mexico nearshoring fuels pricing as space remains scarce.  
Nearshoring amplified demand in Mexico’s manufacturing-oriented markets compared to historical levels (e.g., Monterrey’s net absorption was three times pre-pandemic levels). Replacement cost inputs responded: Land values increased two to three times, and peso appreciation (+25%) added to construction cost growth. Because the surge in demand pushed the vacancy rate down from a long-term average of 7% to around 1% since 2021 throughout Mexico’s six main markets, customers had to compete for limited availabilities. From 2021 to 2023, market rents increased a cumulative 40% in Mexico. Rents in the best markets surpassed US$10 per square foot as replacement costs climbed above US$120 per square foot.

Development economics drive rent growth and a pullback in starts. 
The costs to develop buildings are higher than ever in most markets around the world. Construction costs surged in 2021 and 2022. Construction wage growth continues to outpace inflation, and rising riskfree interest rates pushed up debt costs and return requirements. There was some global divergence in 2023: boosted by competition from manufacturing and infrastructure projects, construction costs increased in the U.S. but decreased in Europe.

Exhibit 2:

Exhibit 3:

Exhibit 4:

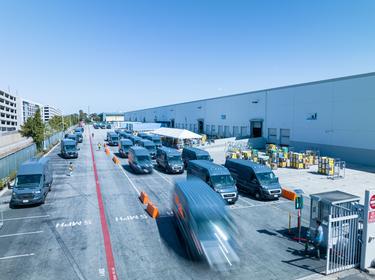
Mexico Near Shoring Image

Regional Highlights

United States/Canada 
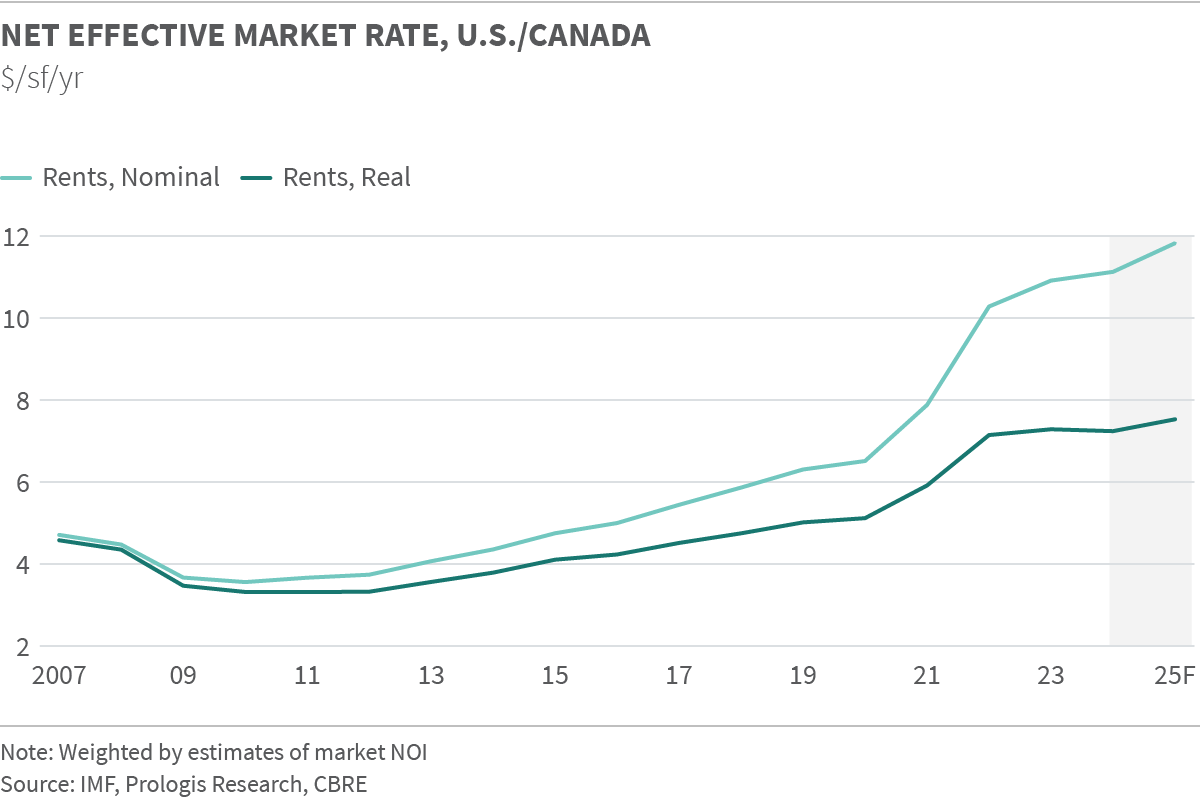
Rents in the U.S./Canada grew by 6% in 2023 after rising a record 30% in 2022. The Southeast and Southwest regions recorded the fastest average growth in rents during the year, including more than 10% in several markets, such as Las Vegas and Central Florida. In the largest coastal gateways, the pace of growth slowed, with a reversal in Southern California and muted growth in New York/New Jersey. Sticky replacement cost rents, boosted by still-high construction costs and increased return requirements, kept a high floor under market rents, even in locations with high levels of new supply.

We expect a near-term rebalancing of supply with demand (a mini-cycle), with the vacancy rate peaking in mid-2024 around 6%—a healthy level relative to the market’s history—before declining again in the second half of 2024, and beyond, as deliveries fall sharply. A reintroduction of scarcity in the market should reaccelerate rent growth.

Exhibit 6:

Exhibit 7:

Rent Index Graph


Asia

China  
Market rents dipped 2.1% in 2023 on record new supply and vacancy rates of more than 20% nationally. The average was held back by an extended downtick in some locations, which exceeded -30% in some submarkets in the North and East regions, where concessions reached up to 20% of lease value. Over time, the unwinding of these concessions could result in sharp jumps in net effective rental rates. The South China region remained stable, with more than 3% rent growth, as vacancy rates in most markets were in the low- to mid-single digits.

Japan  
Both new deliveries and new demand set records in 2023. With the market in rough equilibrium, market rents recorded steady 1.8% y/y growth. Vacancy rates are rising in pockets of Japan with a high level of new deliveries in peripheral submarkets of major metros and regional markets, such as Nagoya. We expect limited impact on rents, however, with new structural drivers for regional and secondary locations, including re-shored manufacturing and truck stop points when legislation reducing continuous truckdriver working hours takes effect in 2024.

Europe 
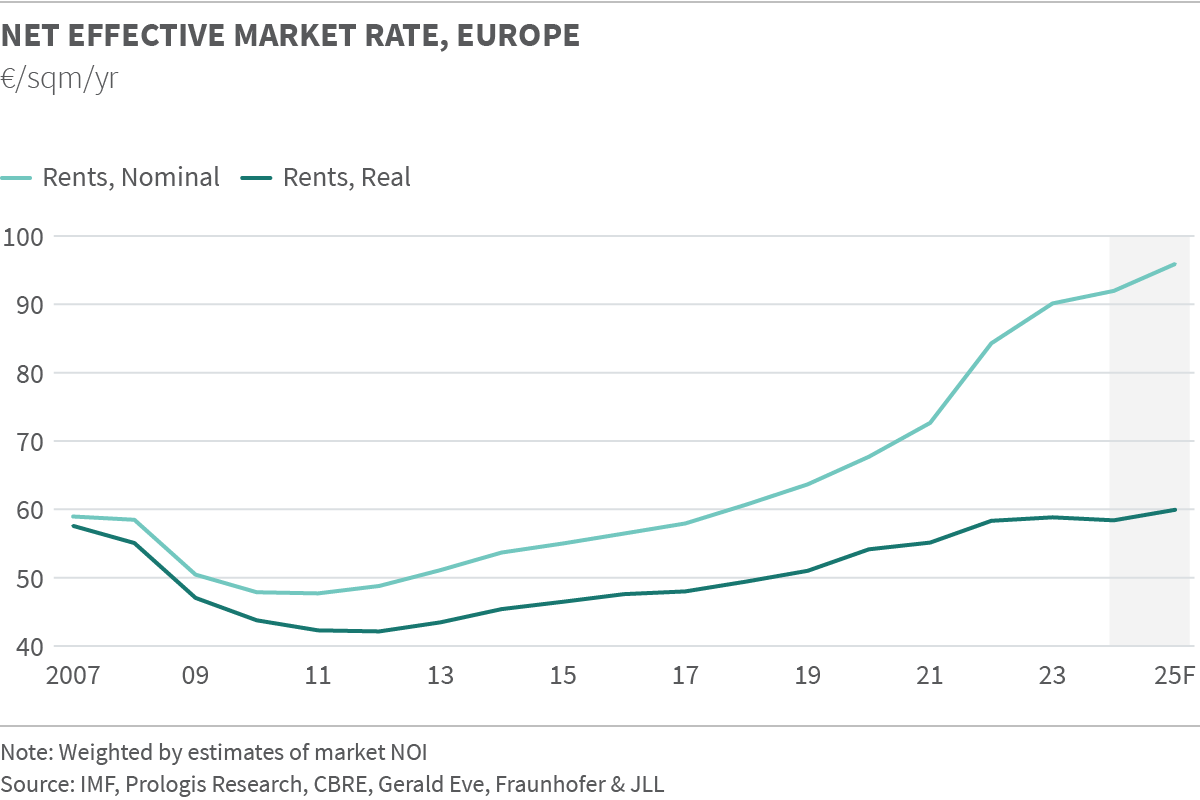
In 2023, rents grew by 7%. Performance diverged by location, with markets failing into four groups:

  • Supply-constrained markets with healthy growth that benefit from structural trends (e.g., Germany and the Netherlands).

  • Markets with traditionally modest growth that continued to grow at a defensive pace (e.g., France).

  • High-cost markets where rents stabilized at high levels (e.g., London and Prague).

  • Select markets where elevated deliveries drove an increase in concessions (e.g., Poland).

Looking ahead, Europe is likely to see a lower peak in the vacancy rate during the upcoming mini-cycle because new construction starts fell earlier than in the U.S. and other global markets. Improvement in the demand backdrop could cause rent growth to reaccelerate quickly as scarcity returns to many markets on both the Continent and in the United Kingdom.

Exhibit 8:

Exhibit 9:

Ren Index Chart


Latin America

Mexico  
Driven by nearshoring activity, demand reached all-time highs, growing 8% from the prior record. Increased new supply and frictional vacancy pushed up the vacancy rate from 0.9% in Q4 2022 to 1.4%. The sustained scarcity, coupled with rising construction costs and limited availability of land plots interconnected to the power grid, produced competition for availabilities and 19% rent growth in 2023. We expect vacancy rates to hover around 2% through the near term, keeping upward pressure on rents.

Brazil  
Market rents for Class AAA space in the Southeast increased 11.3%. Record-high demand and a sharp decline in deliveries produced a 320 bps decline in overall market vacancy to 11.4%, the lowest level on record. 2023 development starts ground to a halt (42% below 2022), owing to near-prohibitive debt costs. As a result, we expect vacancies to decline further, driving competition for space and rent growth in 2024.

Endnotes

  1. Source: U.S.: CBRE, C&W, JLL, Colliers, CBRE-EA, Prologis Research. EU: CBRE, C&W, JLL, Colliers, Fraunhofer, Gerald Eve Prologis Research.
  2. Source: Prologis Research.
  3. Source: IMF, Consensus Forecasts, CBRE Prologis Research.
  4. Source: IMF, Prologis Research, CBRE.
  5. Source: IMF, Prologis Research, CBRE, Gerald Eve, Fraunhofer & JLL.

Forward-Looking Statements

This material should not be construed as an offer to sell or the solicitation of an offer to buy any security. We are not soliciting any action based on this material. It is for the general information of customers of Prologis.

This report is based, in part, on public information that we consider reliable, but we do not represent that it is accurate or complete, and it should not be relied on as such. No representation is given with respect to the accuracy or completeness of the information herein. Opinions expressed are our current opinions as of the date appearing on this report only. Prologis disclaims any and all liability relating to this report, including, without limitation, any express or implied representations or warranties for statements or errors contained in, or omissions from, this report.

Any estimates, projections or predictions given in this report are intended to be forward-looking statements. Although we believe that the expectations in such forward-looking statements are reasonable, we can give no assurance that any forward-looking statements will prove to be correct. Such estimates are subject to actual known and unknown risks, uncertainties and other factors that could cause actual results to differ materially from those projected. These forward-looking statements speak only as of the date of this report. We expressly disclaim any obligation or undertaking to update or revise any forward-looking statement contained herein to reflect any change in our expectations or any change in circumstances upon which such statement is based.

No part of this material may be (i) copied, photocopied or duplicated in any form by any means or (ii) redistributed without the prior written consent of Prologis.

About Prologis Research

Prologis’ Research department studies fundamental and investment trends and Prologis’ customers’ needs to assist in identifying opportunities and avoiding risk across four continents. The team contributes to investment decisions and long-term strategic initiatives, in addition to publishing white papers and other research reports. Prologis publishes research on the market dynamics impacting Prologis’ customers’ businesses, including global supply chain issues and developments in the logistics and real estate industries. Prologis’ dedicated research team works collaboratively with all company departments to help guide Prologis’ market entry, expansion, acquisition and development strategies.

About Prologis

Prologis, Inc. is the global leader in logistics real estate with a focus on high-barrier, high-growth markets. As of June 30, 2023, the company owned or had investments in, on a wholly owned basis or through co-investment ventures, properties and development projects expected to total approximately 1.2 billion square feet (111 million square meters) in 19 countries. Prologis leases modern logistics facilities to a diverse base of approximately 6,700 customers principally across two major categories: business-to-business and retail/online fulfillment.

Park Grande, Building

LET'S GET STARTED

Every connection starts with a conversation. Our team is here to help.