The industrial cycle in the U.S. is picking up. Occupancy gains and rent growth are spreading to more markets as the recovery broadens. Looking forward, rents have substantial room to grow as they remain 17% below their prior peak (21% on an inflation-adjusted basis), and anywhere from 5-20% below replacement-cost-justified rents in most markets. Significant increases in market rent are already occurring in early-recovery submarkets. As a result, investment opportunities are becoming attractive in more markets with a wider range of risk profiles. However, superior locations within global markets will continue to drive long-term outperformance.
EXECUTIVE SUMMARY
The industrial recovery is strengthening. New starts remain well below historical norms, which means new demand can quickly tighten the market. In fact, supported by robust net new demand, the vacancy rate declined 30 bp in the fourth quarter of 2012, the largest quarterly decline since 2006. Previously, the industrial recovery had been gradual, moderated by the depth of the economic recession. The severity of the downturn for industrial drivers was atypical for two reasons: the withdrawal of credit to finance trade and uncertainty surrounding retail sales as consumers de-leveraged. However, industrial drivers have been rising since the end of 2010 and are now mostly above prior peaks. While momentum continues, political headwinds such as the expiration of the payroll tax holiday and expenditure cuts through sequestration temper the economic outlook and add some uncertainty.
The recovery has not been uniform. Demand for larger facilities began strengthening in 2010, well ahead of demand for smaller spaces. Similarly, global markets1 have experienced greater demand and tighter market conditions than regional markets. Within markets, assets located in infill locations have held up better and experienced rent growth earlier than those in outlying locations.
Recent headwinds are becoming tailwinds. Small-space vacancies are filling and regional markets are tightening; together, these forces are beginning to support rent growth. Hence, for a period of time, performance of assets across a wider range of size segments and geographies will improve as the industrial recovery broadens. In the longer term, investment performance will depend on the intrinsic drivers of industrial, including consolidation into larger properties. This is particularly true in infill locations in global markets, where higher barriers to supply can lead to rent growth.
The rent-recovery cycle, now firmly under way, is poised for accelerating growth. Rents remain well below benchmarks like the prior peak (17% below) and replacement-cost-justified rents (roughly 5-20% below in most markets, and costs are rising). Effective rents are forecasted to rise 25% during 2013- 2016, as face rates rise 20% or more and recessionary concessions burn off. We have already seen rent begin to approach prior-peak levels in select early-recovery submarkets within Southern California, Miami, Houston, Central Pennsylvania and Phoenix.
EMERGING FROM THE GREAT RECESSION
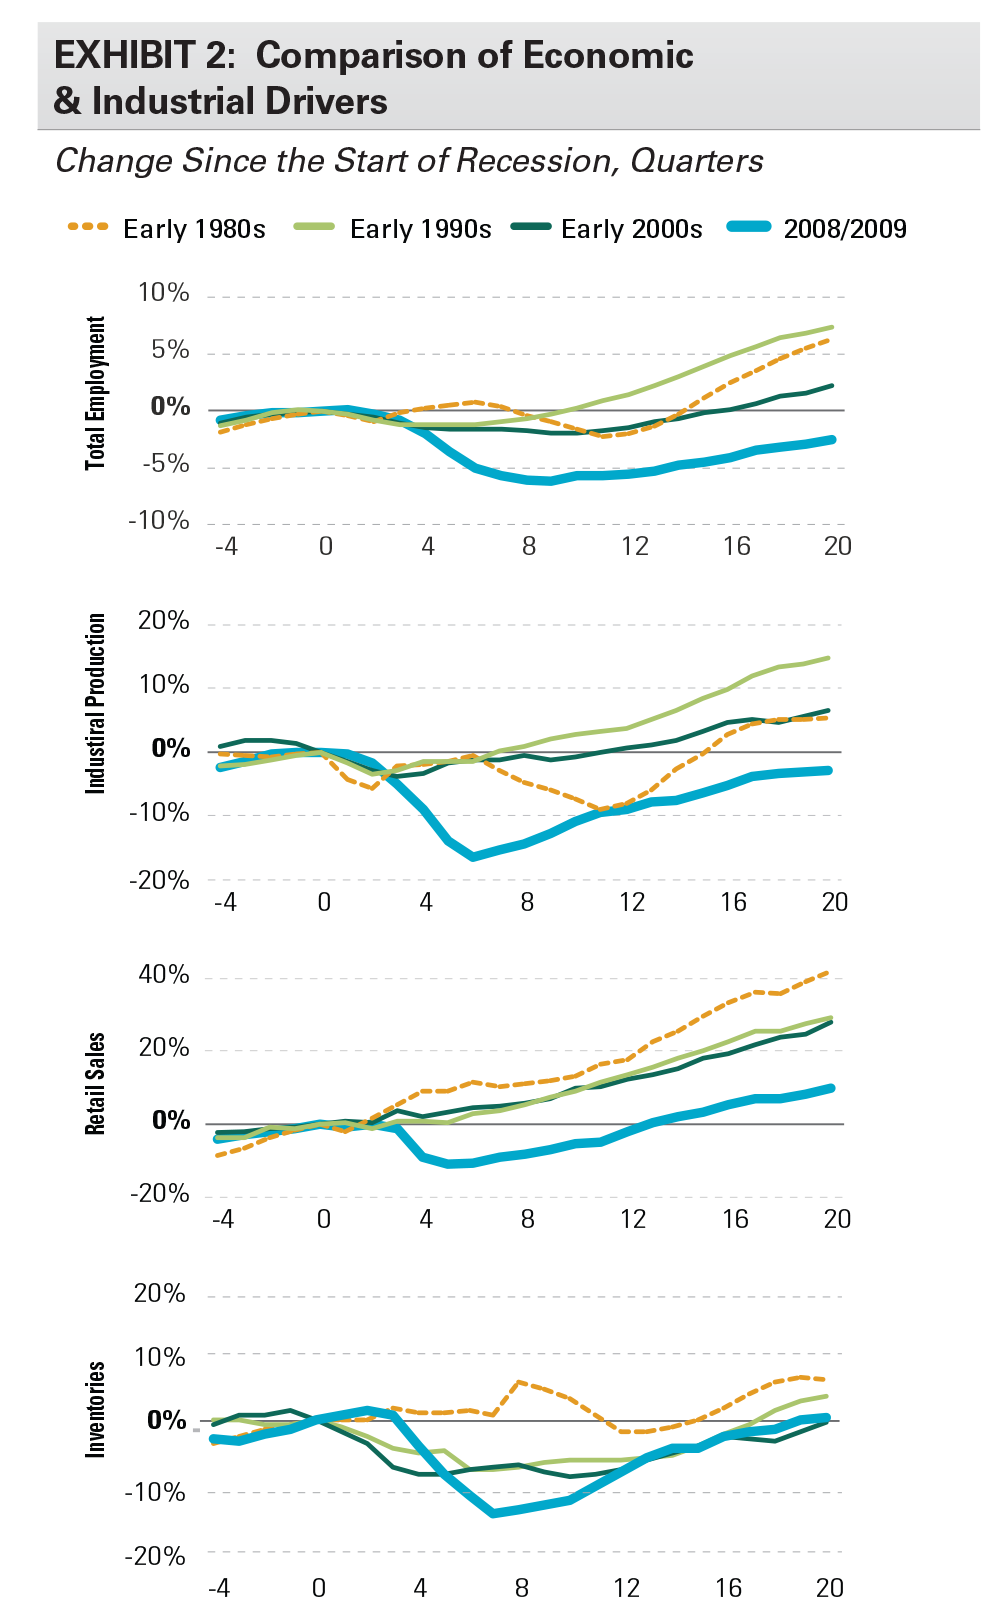
While the global financial crisis was the worst downturn since the Great Depression, economic indicators have now mostly surpassed prior peaks, creating new demand for industrial real estate. Exhibit 2 compares selected economic and industrial indicators across the last four recessions (early 1980s, early 1990s, early 2000s and 2008/2009). The data are indexed to the start of each recession, running from one year before the start of the recession (four quarters) to five years after (20 quarters). We are in the 21st quarter of the current cycle. Highlights include:
- The employment recovery, particularly salient as an indicator for most real estate sectors, has been slow, as productivity increases allowed the economy to grow without the need for meaningful employment increases.
- Key industrial demand drivers such as industrial production, retail sales, and nominal inventories had deeper declines, but subsequently staged a stronger recovery and now have momentum.
- Industrial production slumped 17% within two years from the onset of recession, but has recently approached its prior peak.
- Retail sales dropped 11% within 18 months of the start of the recession, but subsequently bounced back, surpassing the prior peak in early 2011. Sales are now 10% above the prior peak on a nominal basis, and are also ahead after adjusting for inflation.
- Similarly, nominal inventories surpassed their prior peak two years ago. Inflation-adjusted inventories are currently approaching their prior peak.
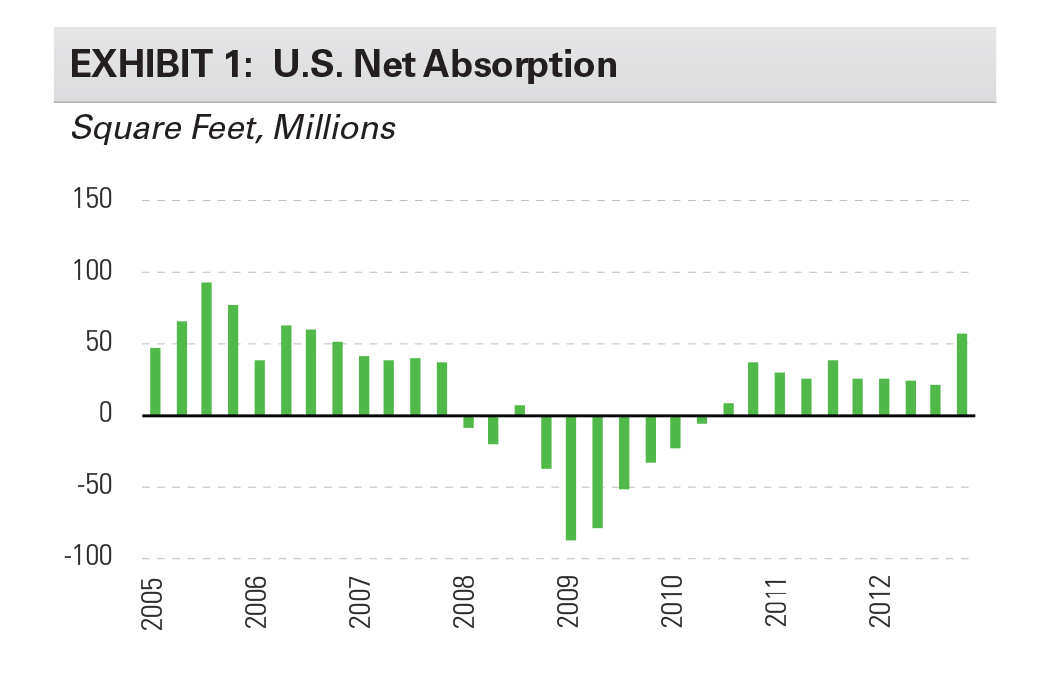
The maturing economic recovery is increasingly supporting an industrial market expansion. Waning economic and political uncertainty, coupled with the weight of previously deferred leasing decisions, has led the pace of the industrial recovery to pick up. Moreover, the U.S. population has risen by 12 million in the past five years. Net absorption has been positive in each of the past 10 quarters, but the fourth quarter of 2012 was the strongest since 2006.
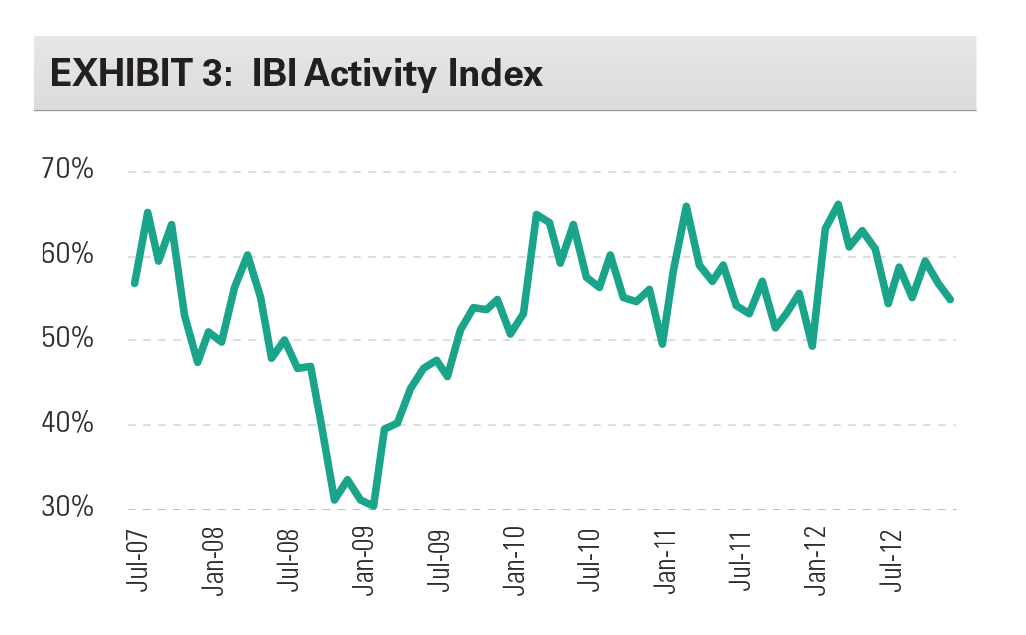
Similarly, our proprietary Industrial Business Indicator survey of customer activity achieved its highest-ever level in the third and fourth quarters of 2012. As the index has a 0.87 correlation with one quarter lead and a 0.78 correlation with two quarter lead of net absorption, recent results imply momentum should continue into the first half of 2013 at a minimum.
CONTOURS OF THE U.S. INDUSTRIAL RECOVERY
The pace of recovery has been varied, but it has become more evenly distributed in recent quarters. New starts remain below historical norms and below the obsolescence rate (50-75 msf, in our view), so new demand quickly tightens the market. Three distinct themes among space, size and location have emerged:
- Large properties initially outperformed small
- Global markets outperformed regional
- Infill submarkets outperformed exurban
Larger facilities have outperformed smaller ones; demand experienced a shallower recession and an earlier recovery. Users of larger facilities often are established enterprises with stronger balance sheets and better access to credit, positioning them to withstand recessions. Exhibit 4 shows the change in occupied industrial stock by size of building (e.g., demand growth). It reveals that demand growth for large facilities remained positive throughout the recession. In contrast, smaller facilities experienced a decline in demand and required three extra quarters to bottom.
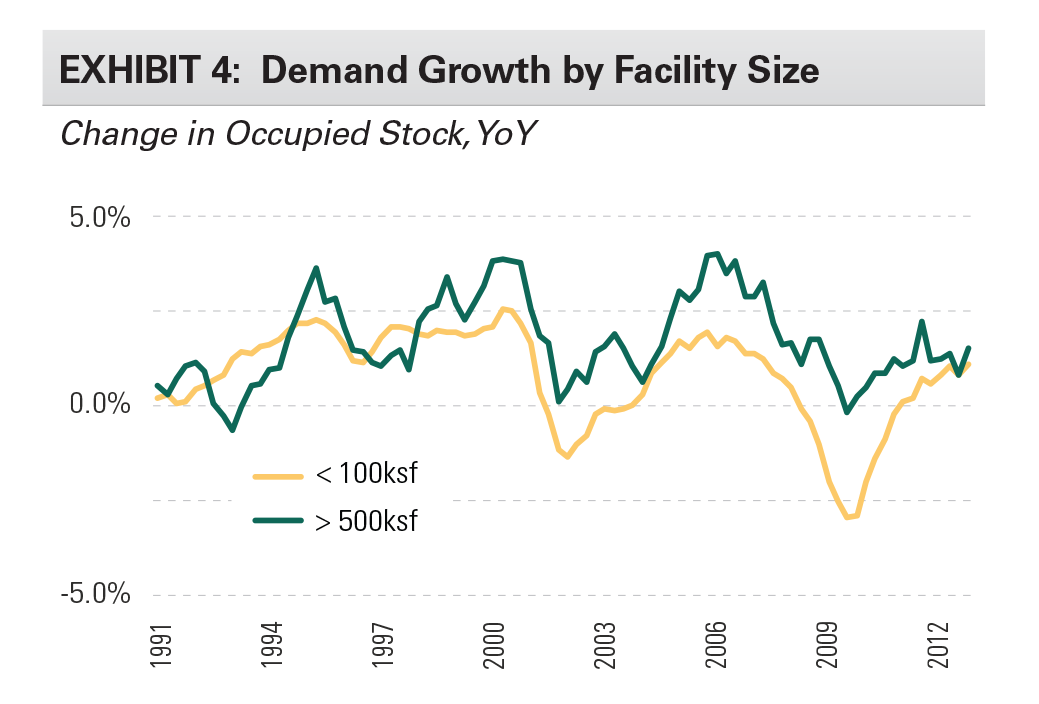
There are multiple drivers for this outperformance. E-Commerce requirements have represented a notable share of new demand (for example, more than one-third of 2012 build-to-suit requirements were e-commerce-related, which we explore in greater detail on the following page). More generally, larger tenants from a host of industries were positioned to make opportunistic leasing decisions early in the economic recovery when rents were low and economic uncertainty was high. Consolidation into modern, larger properties often creates cost savings elsewhere in the supply chain. However, we have also seen a push to be closer to the customer in global markets, driving demand in infill locations, which tend to be midsize facilities. Further, while smaller users were especially stretched by the recession, they have recently (since mid-2012) begun playing a greater role in the leasing markets.
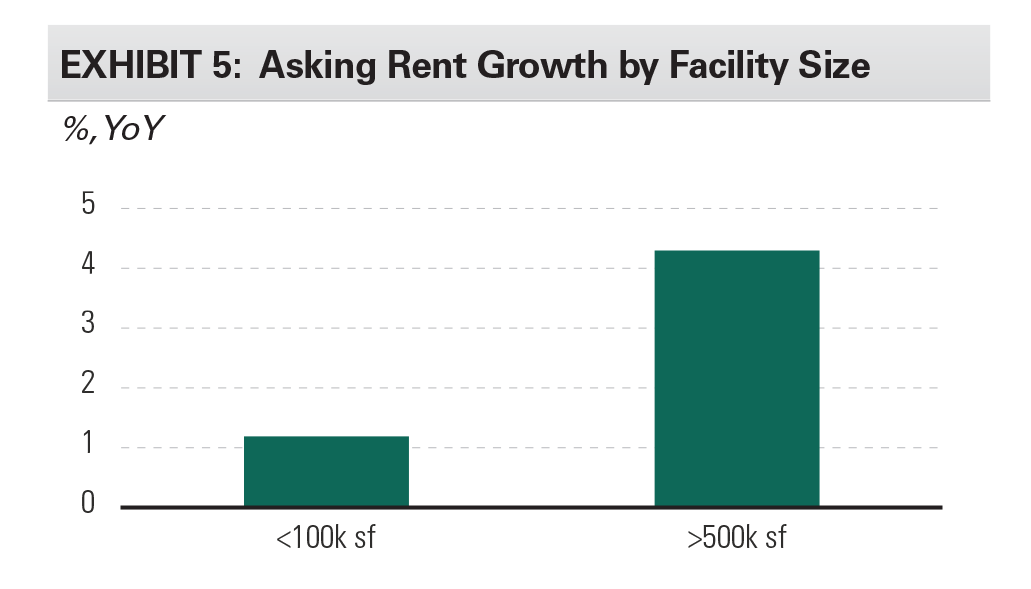
Rent recoveries by asset size also differs and mirrors demand trends. Exhibit 5 shows rent growth by size segment. Rents rose 4.3% for facilities of more than 500,000 sf during 2012, as compared with just 1.2% for facilities of less than 100,000 sf. User demand returned earlier and stronger for large facilities, leading to tighter conditions and greater rent pressure.
Looking forward, small facilities will likely see continued momentum. Total occupied stock grew by 1.4% in 2012, only modestly below its 20-year trend. Advancing and broadening economic growth, along with improving credit availability for small businesses, will continue to support demand for smaller facilities, in our view.
The housing recovery in particular should help accelerate demand from smaller users. U.S. housing starts totaled 780,000 in 2012, and up to 97,000 by December2. Home construction is forecasted to rise above 1 million in 2013, up more than 25%3. Furthermore, home sales typically lead to follow-on sales such as white goods and furniture, additional positives for warehouse demand.
While smaller facilities will narrow the performance gap, longer-term investment strategies should consider warehouse’s fundamental drivers. We expect customers to remain focused on facilities that deliver efficiencies to their supply chains, which tend to be midsize and larger facilities, often in infill locations. For example, we sampled rent growth for Los Angeles area properties of <100,000 sf as compared with properties of >200,000 sf5. The rents grew faster through full cycles for the large facilities, rising 103% from 1993 to 2008 for larger properties as compared to 91% for smaller facilities.
E-Commerce and the U.S. Industrial Market:
Online sales reached a tipping point in 2012, and led to strong growth for warehouses. E-commerce requirements accounted for over one-third of all U.S. build-to-suit requirements during 2012. According to the Census, e-commerce sales totaled $225 billion in 2012, more than doubling since 2005, and the U.S. stands as the world’s largest e-commerce market. Multichannel retailers already have 10% e-commerce penetration or more, of their total sales, and rising from there, a critical component of the overall trend of e-commerce.
However, “It’s still Day One”5 for e-commerce. The penetration of e-commerce as a share of retail sales globally was just 6.5% in 2012, and is forecast to rise to 9.3% in 2016. Penetration rates are higher in developed economies, such as the U.S., U.K. and Japan; however, emerging markets such as China and Brazil are quickly closing the gap. E-commerce growth rates in emerging markets have reached double digits, with penetration rates projected to rise 250-500 bp5 during the next four years.
e-Commerce is more than just online-only retailers. While online-only retailers seemingly define e-commerce, and several, such as Amazon.com, are among the largest players, traditional brick-and-mortar retailers are an important part of the growth trend. In fact, at 47%, retailers and brand manufacturers comprise a greater share of e-commerce sales in the U.S. than do web-only retailers, at 41%. Furthermore, a variety of retailer categories are experiencing greater than 20% growth in the U.S., including niche retailers in the toy, hardware, apparel and media subsectors6.
e-Commerce creates net new demand for warehouse space. Going forward, e-commerce will continue to claim an outsized share of retail sales growth. The largest multichannel retailers maintain two supply chains: one to serve their bricks-and-mortar stores; and one to serve their e-commerce activities, often independently. Consequently, e-commerce creates net new demand for warehouse in part by taking share from retail square footage, in our view.
Understanding e-Commerce Requirements
Dedicated e-commerce facilities have unique needs. Primarily, these facilities are called upon to stock higher levels of SKUs and have a greater intensity of item-picking as compared to conventional distribution centers. Consequently, the work can be labor intensive, requiring increased staff levels compared to typical facilities. Also, many facilities support reverse logistics (i.e., returns), requiring dedicated floor space.
However, these unique e-commerce requirements fit into existing assets. Notable requirements include: 1) a high ratio of loading dock doors to accommodate the frequency of truck traffic; 2) greater mezzanine space for order fulfillment, clerical work and break areas; 3) a higher employee parking ratio to accommodate greater staffing density; 4) increased security measures; and 5) close proximity to populations. Bottom line, these requirements are met by existing facilities despite the seemingly unique needs
GLOBAL MARKETS LEAD THE U.S. RECOVERY
The pace of recovery varies across U.S. markets; global markets lead and regional markets follow. Global markets are magnets for industrial activity, driven by high international and domestic consumption and above-average income. Additionally, they are generally among the largest population centers across the U.S. Consequently, while global markets represent 45% of U.S. inventory, they garnered 55% of net new demand during the past decade, a trend that continued through the economic recovery.
Exhibit 6 presents the recent occupancy cycle. Occupancies in global markets rose 110 bp during 2012, outpacing regional markets, which gained 40 bp. Consequently, tight market conditions in several global markets are supporting outsized rent gains, whereas weaker fundamentals in many regional markets have limited rent gains.
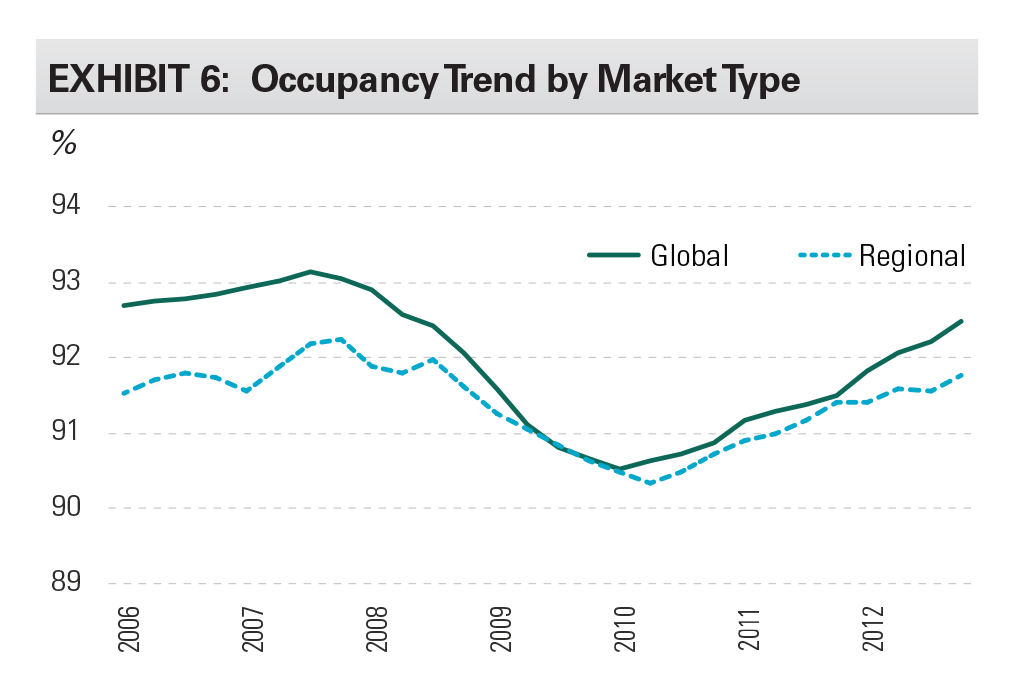
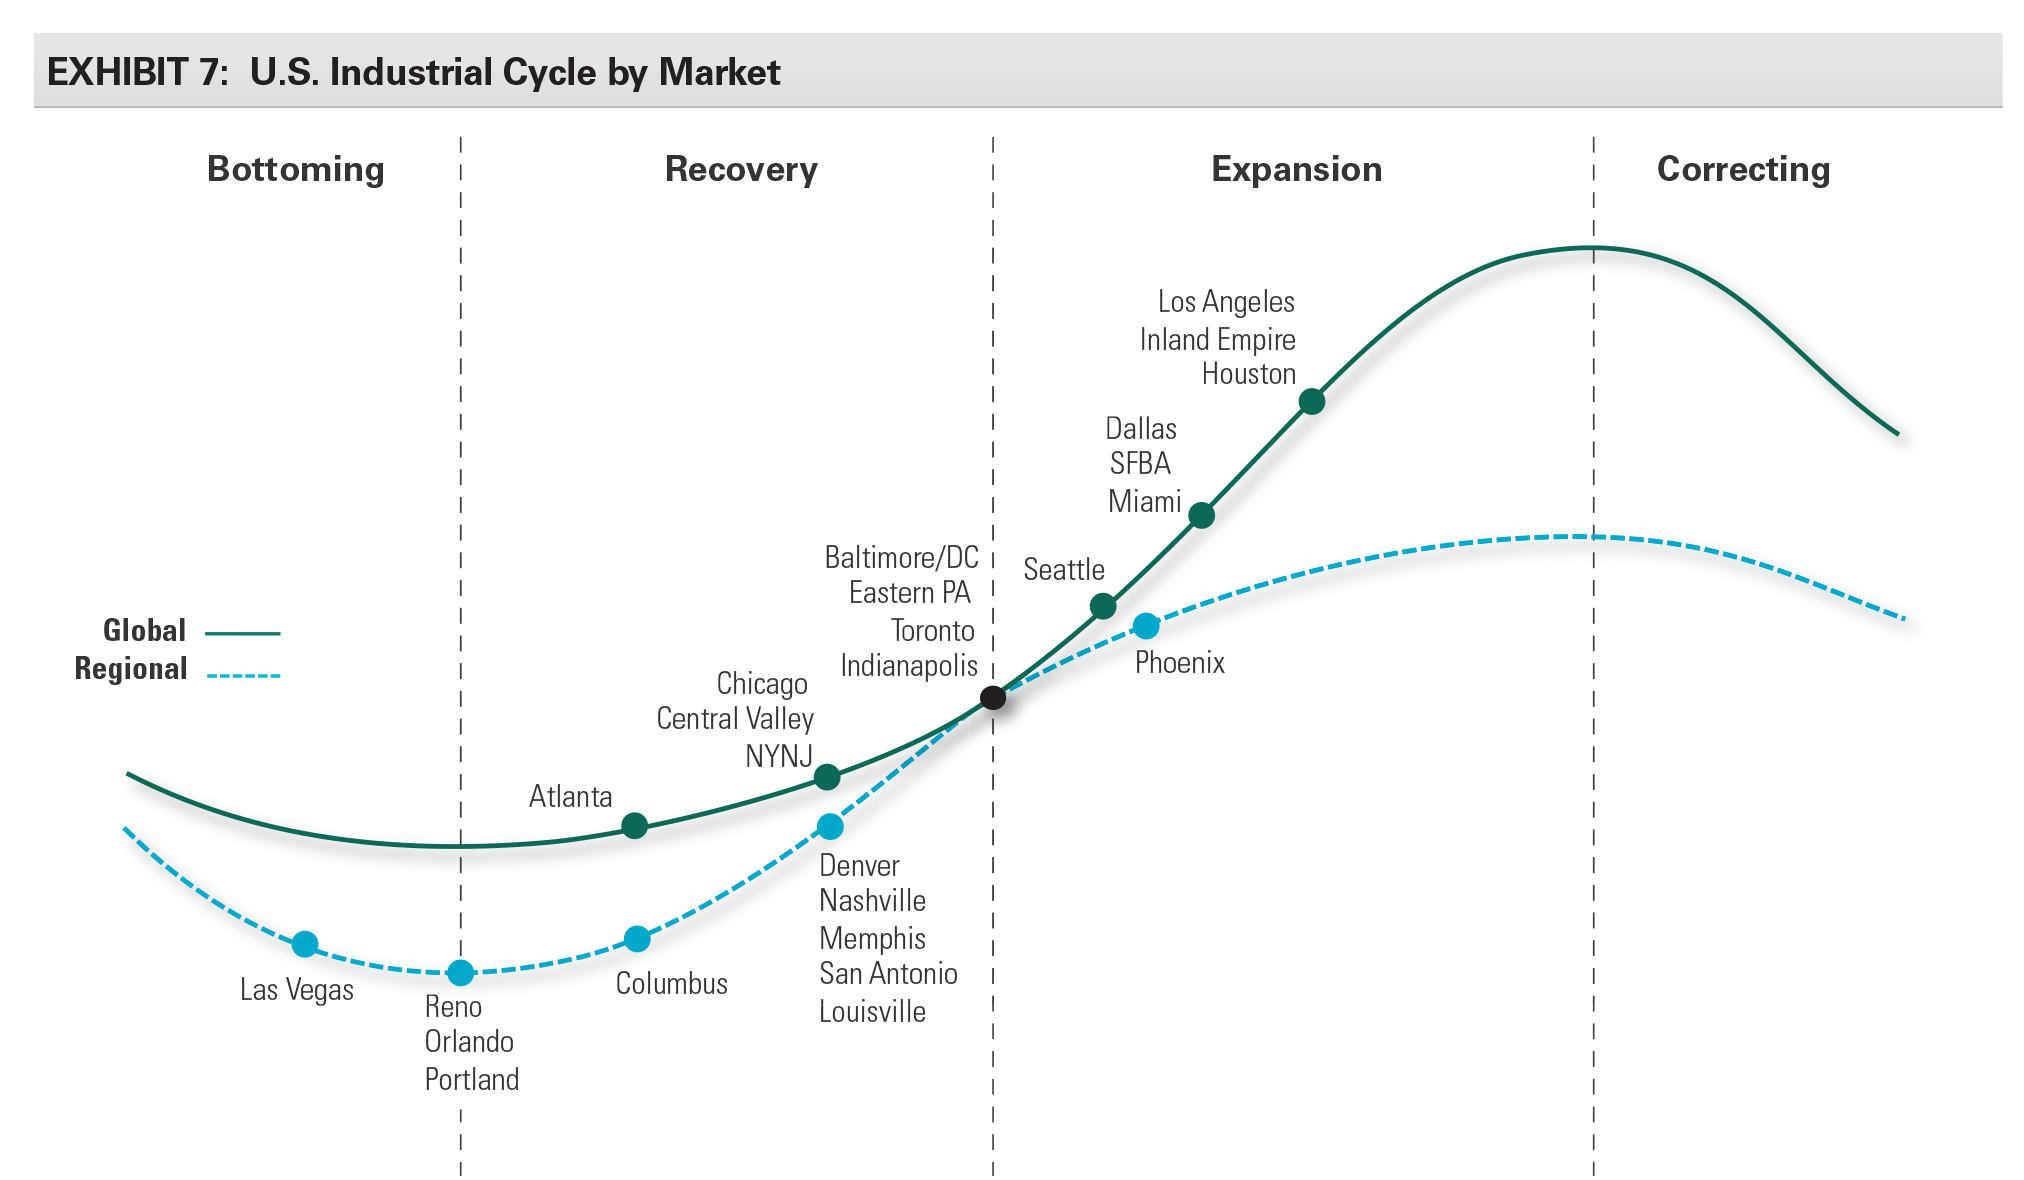
Exhibit 7 maps U.S. markets to their stage in the industrial cycle, with separate cycles for global and regional markets. Simply put, global markets have recovered first. Highlights for key markets:
- Southern California – The strongest market in the U.S., demand returned more quickly and strongly, as the market serves as the primary U.S. gateway to Asia. Rising transloading in port markets, which accelerated during the recession as retailers reduced inventories, has also been a positive. Rents have approached their prior peak level; however, tight vacancies indicate further upside.
- NY/NJ – Recovery has been gradual as economic and demographic growth in the Northeast has been muted. Pennsylvania is competing successfully for users in this market, yet the proximity to the port remains important.
- Dallas – While demand retreated in Dallas as in other markets, the downturn was briefer and shallower, which supported a quicker recovery as the U.S. economy picked up. Dallas is an important population center benefiting from healthy demographic trends and business relocations. However, lower barriers to supply as compared with other global markets may mute the pace of rent growth during the expansion.
- Houston – The industrial market has quickly recovered. The market acts as the global seat of the energy industry and has low costs of living and doing business, which attract business and net in-migration alike. However, like Dallas, lower barriers to supply may mute the pace of rent growth during the expansion.
INFILL LOCATIONS HAVE LED THE RECOVERY
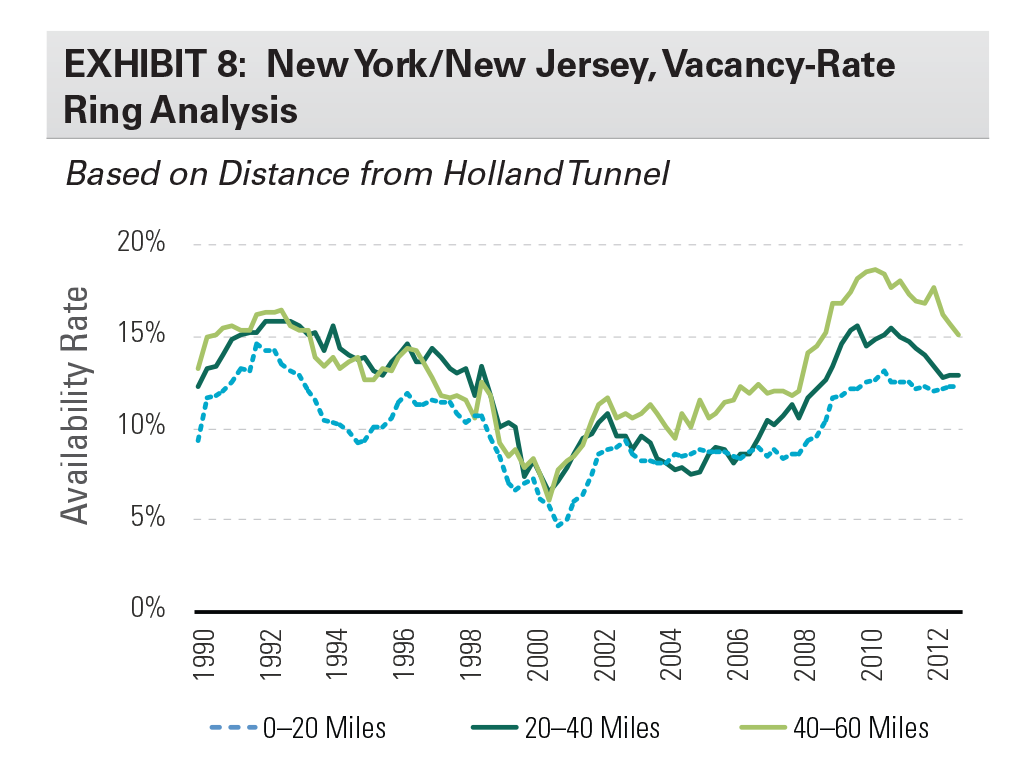
Infill submarkets have led the recovery. These submarkets generally have higher barriers to new development (particularly in coastal markets), limiting speculative construction. Rents in these locations can rise well above replacement-cost- justified rents due to the lack of developable land and user willingness to pay for location. In contrast, outlying submarkets can experience vacancy spikes, as overbuilding late in the cycle delivers excess supply during recessions. For example, the chart below presents the vacancy cycle in New York and New Jersey segmented into three groups: 1) properties within 20 miles from the Holland Tunnel; 2) properties 20-40 miles from the Holland Tunnel; and 3) properties 40-60 miles away. Infill submarkets outperformed outlying locations; the availability rate rose 430 bp for the innermost band during the recession, while they rose 670 bp for the outermost band.
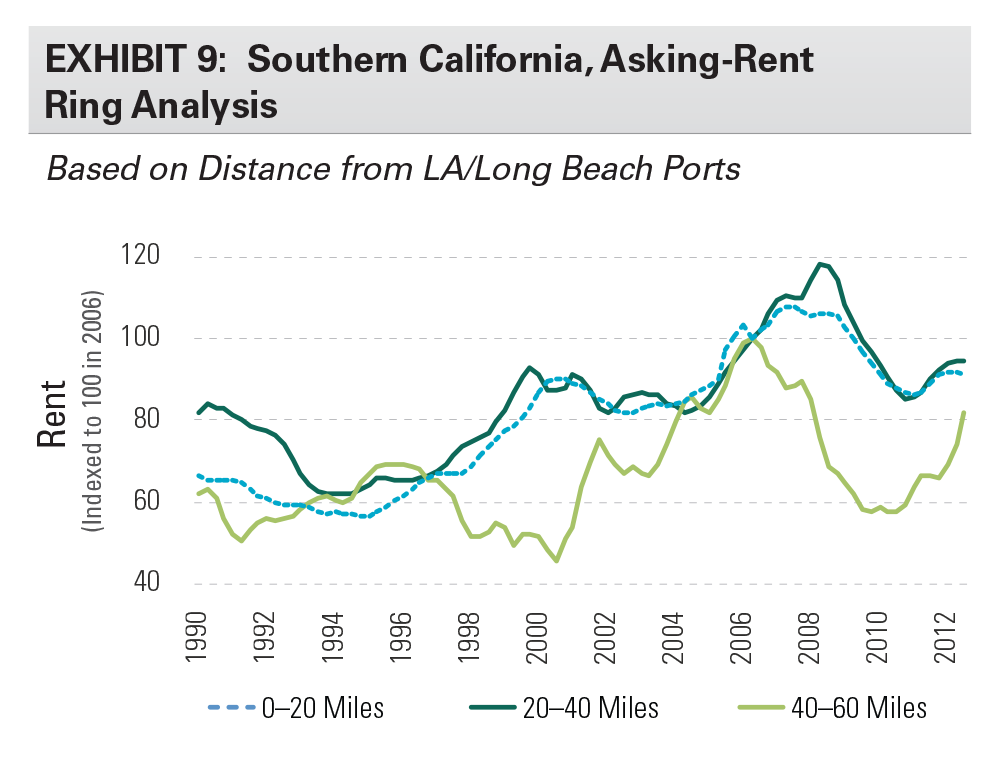
Outlying submarkets eventually catch up, offering an opportunity for outsized growth as markets tighten and return to prerecession norms, although timing varies by market. Broadening economic recovery eventually fills vacancy, particularly as new development remains on hold for a period of time. For example, Southern California has already seen recovery in the Inland Empire. Rents, which fell by more than a third during the recession, have grown 40% in the last two years and are approaching their prerecession peak. Certain niches, such as properties of >250,000 sf, already have effective 0% vacancy rates, leading to even stronger rent performance. In fact, recovery has been sufficiently strong that the market is beginning to see significant new supply.
INCREMENTAL INDUSTRIAL DEMAND TO COME AS LEAN INVENTORY LEVELS REQUIRE RESTOCKING
We see near-term upside to industrial demand as retailers restock due to low inventory levels. While inventory levels as a proportion of sales (the I/S ratio) has declined for decades, opportunities for growth emerge during economic recoveries. Distributors typically slash inventory levels as sales decline and uncertainty rises. However, as sales increase and confidence returns, costs associated with stock-outs increase in importance and distributors begin to carry higher and more appropriate levels of inventories. Broadening product lines and distribution channels further augment inventory growth during economic expansions.
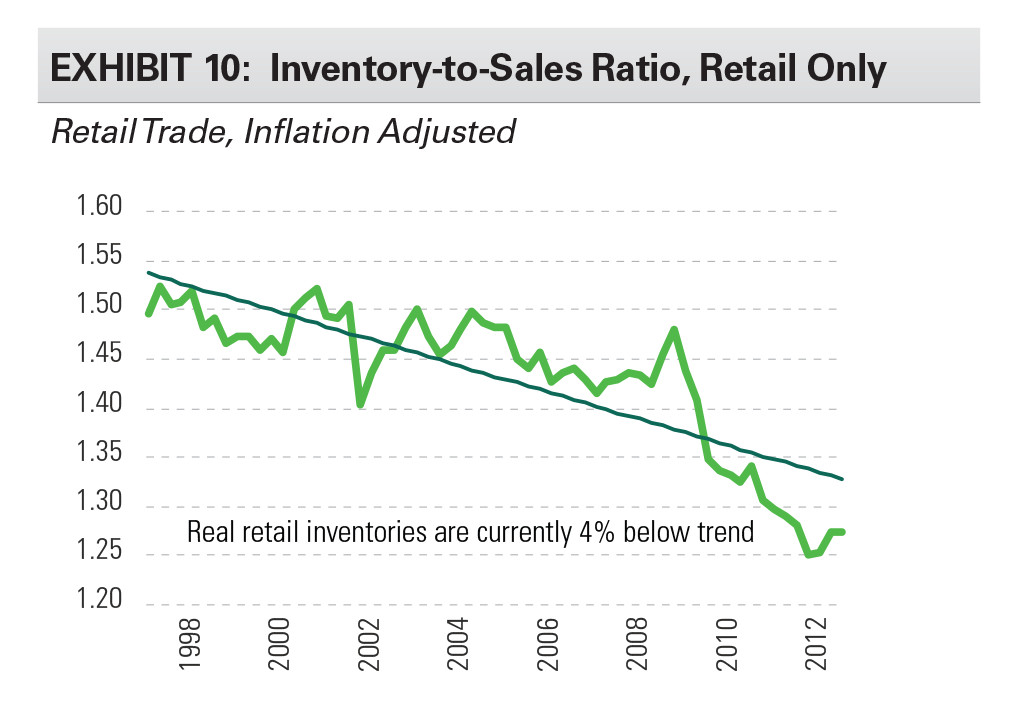
A recovery is already taking hold, with potential for solid growth during the coming years. Real inventories have been increasing for 12 of the last 13 quarters. However, retail sales have recovered even faster, leaving the I/S ratio for retailers near a record low and well below trend. Inventories are currently 4% below their long-term trend. Furthermore, rising sales will continue to augment growth of inventories in the coming years, adding several points of growth (approximately 2% per year). Finally, the I/S ratio has historically risen above trend, not just back to trend, as the economic recovery matures. We look for at least 3% inventory growth in each of the next two years.
BROADENING EXPANSION A POSITIVE FOR DRIVING RENTS; 25%7 OVER FOUR YEARS
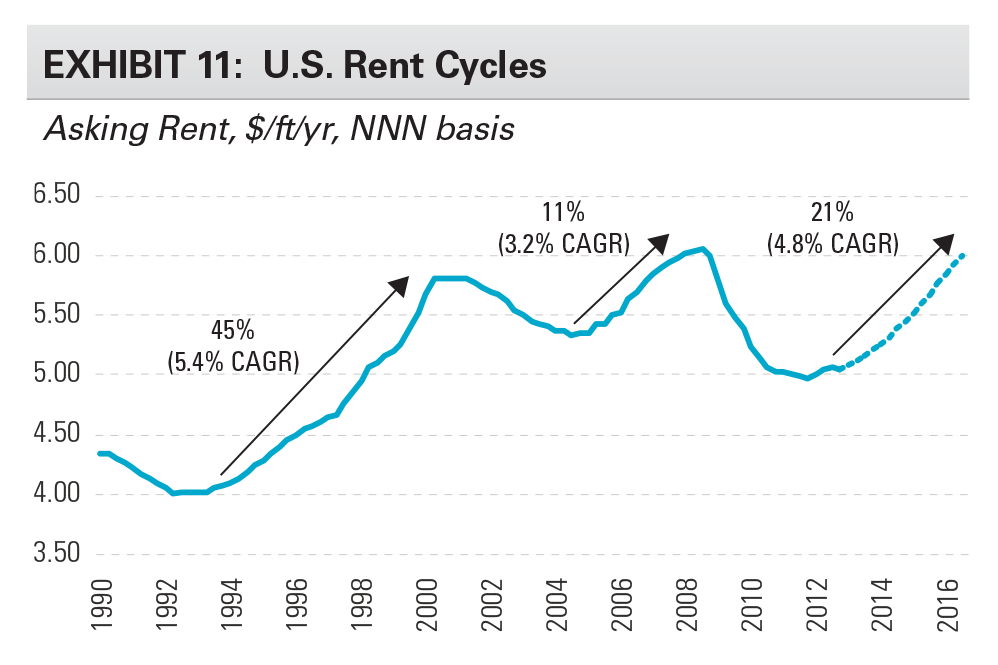
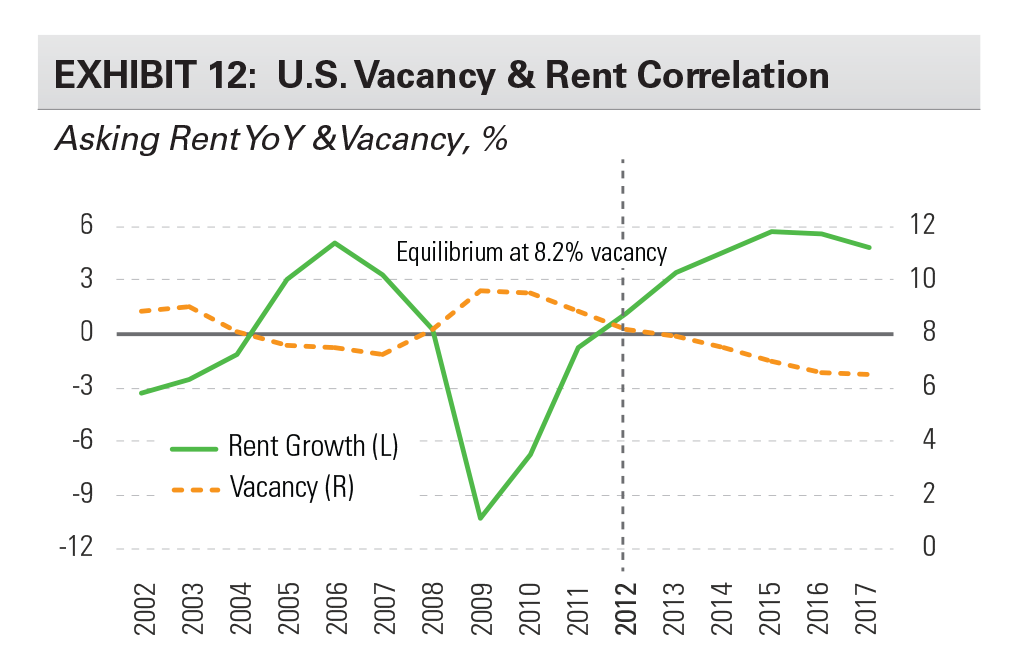
Industrial rents have passed the inflection point and have shown positive momentum up from trough levels, yet still have substantial room to grow relative to prior peaks and replacement-cost-justified rents. Effective rents are forecasted to rise 25% during the next four years (2013-2016) as asking rents rise 20% or more and concessions normalize. Two factors give us confidence in this view. First, much of this gain will be driven by a broad return to prior-peak rents, as we have seen in early-recovery submarkets. Second, a forecast based on the historical correlation between rent growth and vacancy levels reaches a similar conclusion.
A return to prior-peak rents would mean 21% growth from current levels. Historically, rents have surpassed prior peaks during the subsequent recovery. Even the hardest-hit markets recover, as weak rents prohibit construction and support recovery. Consequently, the deep correction in rents in the current cycle augurs well for a similarly notable recovery as excess supply is absorbed.
The historical correlation between vacancies and rents indicates 25% effective rent growth over four years. There is a natural relationship between scarcity (vacancy) and pricing (rents). Exhibit 12 shows a strong correlation between vacancy and rents (-0.93). Further, the “equilibrium” vacancy level, where rent growth = 0%, is 8.2%. The current U.S. vacancy rate is 8.1% and is projected to fall 160 bp during the next five years.
CONCLUSION
The U.S. industrial cycle is building upon positive momentum. While headwinds such as the expiration of the payroll tax holiday and expenditure cuts through sequestration temper the economic outlook, the industrial recovery is expanding. New construction starts remain low and well below the rate of obsolescence. Demand is spreading across more asset sizes and markets, supporting rent growth. Significant growth in earlier-recovery submarkets is already occurring. Based on a confluence of these factors, effective rents in the U.S. are forecasted to rise 25% during the next four years (2013-2016).
Timing and asset selection matters as much now as it has in the past, irrespective of the broadening recovery. We expect a broader uplift in the markets to occur for a period of time. However, long term investment performance will depend upon intrinsic demand drivers of the sector, including consolidation into larger properties, particularly in infill locations in global markets.
Footnotes
- Atlanta, Baltimore/Washington DC, Chicago, Dallas, New York/NNJ, San Francisco Bay Area, Seattle, South Florida, Southern California
- Department of Commerce, seasonally adjusted annual rate
- Wall Street Journal survey, as of January 10, 2013
- To control for potential age differences, we sampled properties built 1970-1985. Property locations were not meaningfully different across our sample groups.
- eCommerce Disruption: A Global Theme Transforming Traditional Retail. Morgan Stanley Blue Paper, January 6, 2013
- Internet Retailer, Prologis Research
- CBRE
Forward-Looking Statements
Copyright © 2013 by Prologis, Inc. All rights reserved.
This material should not be construed as an offer to sell or the solicitation of an offer to buy any security. We are not soliciting any action based on this material. It is for the general information of customers of Prologis.
This report is based, in part, on public information that we consider reliable, but we do not represent that it is accurate or complete, and it should not be relied on as such. No representation is given with respect to the accuracy or completeness of the information herein. Opinions expressed are our current opinions as of the date appearing on this report only. Prologis disclaims any and all liability relating to this report, including, without limitation, any express or implied representations or warranties for statements or errors contained in, or omissions from, this report.
Any estimates, projections or predictions given in this report are intended to be forward-looking statements. Although we believe that the expectations in such forward-looking statements are reasonable, we can give no assurance that any forward-looking statements will prove to be correct. Such estimates are subject to actual known and unknown risks, uncertainties and other factors that could cause actual results to differ materially from those projected. These forward-looking statements speak only as of the date of this report. We expressly disclaim any obligation or undertaking to update or revise any forward-looking statement contained herein to reflect any change in our expectations or any change in circumstances upon which such statement is based.
No part of this material may be (i) copied, photocopied, or duplicated in any form by any means or (ii) redistributed without the prior written consent of Prologis.
About Prologis
Prologis Inc. is the leading owner, operator and developer of industrial real estate, focused on global and regional markets across the Americas, Europe and Asia. As of December 31, 2012, Prologis owned or had investments in, on a consolidated basis or through unconsolidated joint ventures, properties and development projects totaling approximately 554 million square feet (51.5 million square meters) in 21 countries. The company leases modern distribution facilities to more than 4,500 customers, including manufacturers, retailers, transportation companies, third-party logistics providers and other enterprises.
White Paper Contributors
Chris Caton, Vice President – Research
Dave Twist, Vice President – Research
Audrey Symes, Senior Associate – Research
Michael Steingold, Analyst – Research
