The business activity index has made an impressive and sustained recovery after dipping slightly in January. In fact, the three-month averages documented in April and May are among the strongest levels on record, at 61.0 and 60.5 respectively, and the index exceeded our expectations in the first quarter—a seasonal period that is typically slower for many of our customers. The business activity index has indicated economic expansion for 21 consecutive months as our customers’ businesses have been steadily improving since bottoming out in early 2009.
The industrial space utilization index climbed to 55.4, which is the highest reading of the index since April 2008. The index has been above 50 for 11 consecutive months, with the exception of December 2010 when it dropped slightly below 50 due to the stronger than anticipated holiday retail sales, which caused a drawdown in inventories. At the time, we forecasted the index would resume its upward trend as our customers continued to rebuild inventories and increase their utilization of distribution and logistics space.
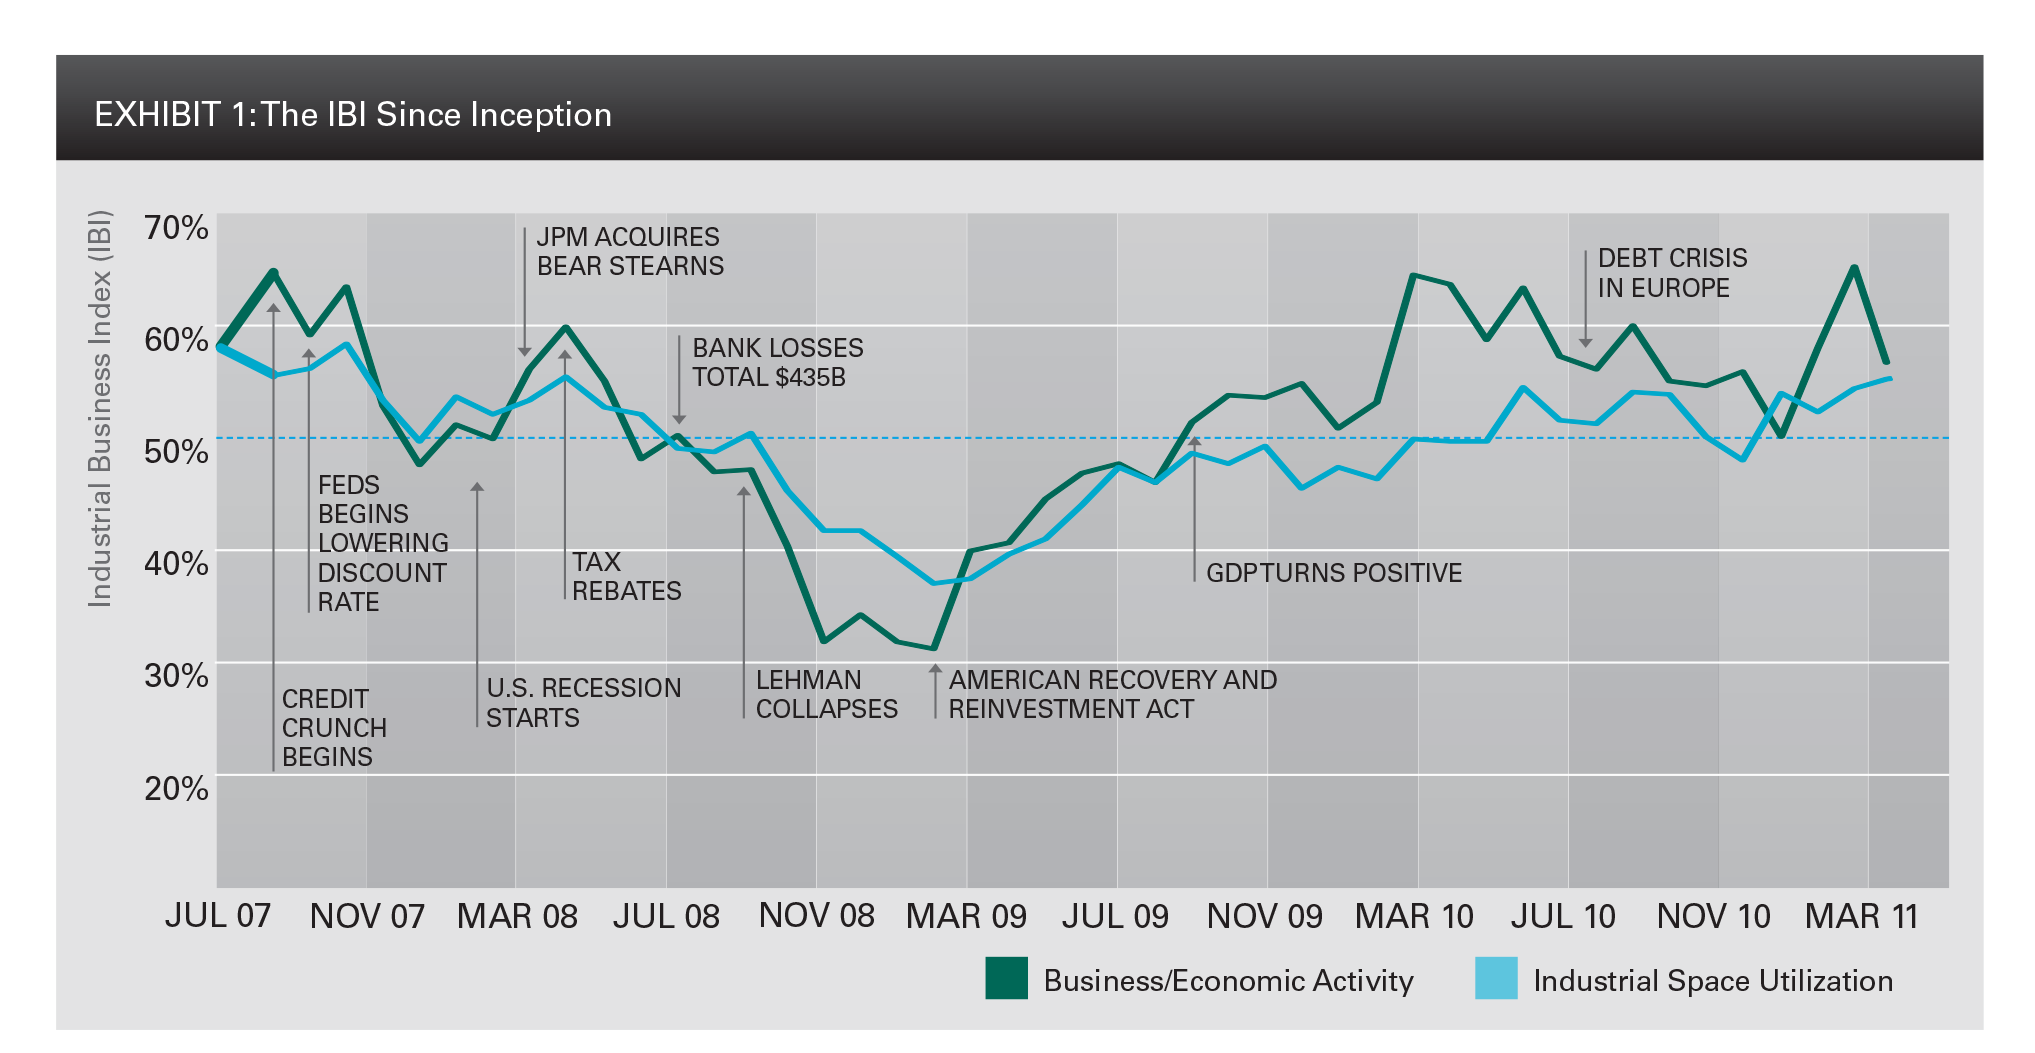
As expected, the space utilization index jumped sharply, to 54, in January 2011 and has increased since then. Movement in the index has been reflected in real inventory growth, which more than tripled between the fourth quarter of 2010 and the first quarter of 2011, when real inventories grew at a 3.0% annualized rate. Importantly, the current level of the space utilization index implies that we will see even stronger inventory growth in the coming months.
In our October 2010 report, the index implied “continued expansion of container volumes and air cargo into the first quarter of 2011, and positive net absorption is expected to continue in the fourth quarter and into 2011.” Both predictions have proven accurate, as cargo levels grew in the fourth quarter of 2010 and growth in global trade remains on track. Net absorption accelerated over this time period, as well.
Market-Level Recovery Broadens
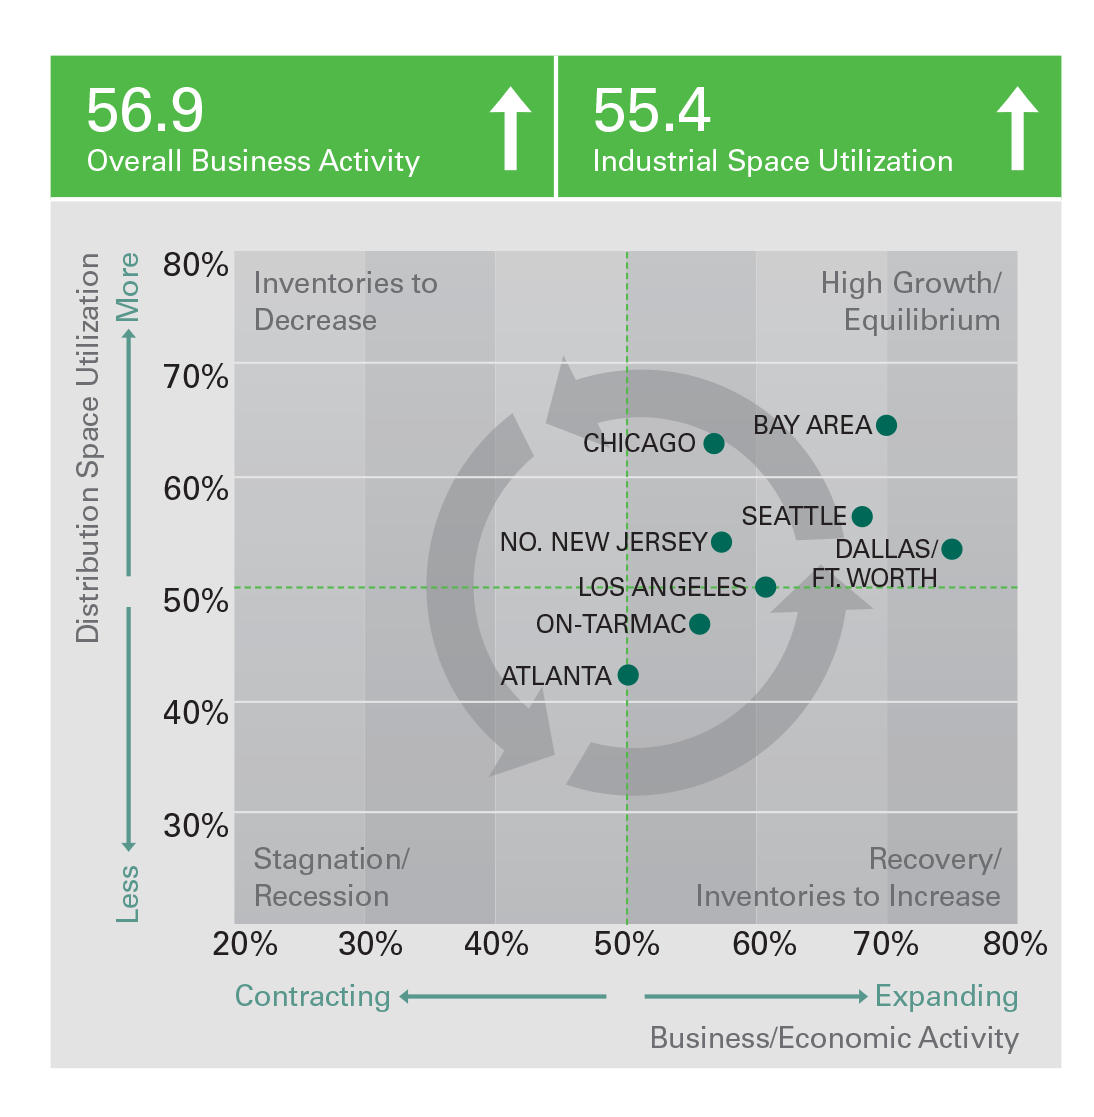
The IBI Market Map, presented for the first time in this report, illustrates that the company’s target markets, with the exception of Atlanta, are experiencing increased business activity. While Atlanta is lagging somewhat, it is moving in a positive direction and on the cusp of expansion, at 50.
In the October IBI, the Market Map indicated that gateway markets would lead the rebound in operating fundamentals and that a stronger recovery would take hold in 2011. This played out as expected with net absorption increasing disproportionately in our gateway markets.
Current data implies that net absorption will gain momentum in the second quarter and through the end of the year across all markets, with key coastal and gateway markets benefiting most from net new demand.
Conclusion
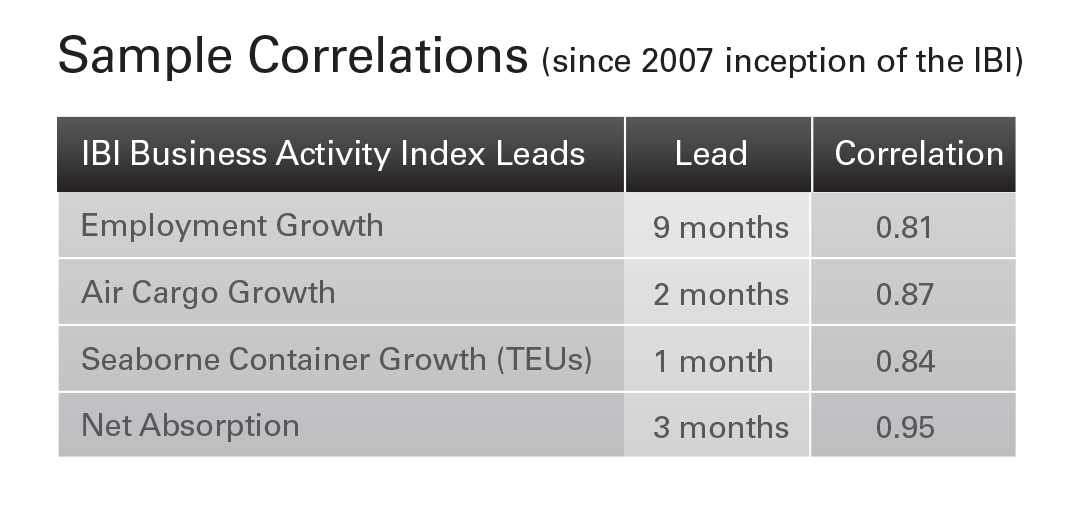
The May 2011 IBI implies that there will be continued growth in global trade over the next two quarters. Furthermore, the strong correlation between business activity and net absorption indicates that demand for logistics space will accelerate over at least the next three quarters. Therefore, we expect to see continued strength in inventories and net absorption throughout the year.
We will be closely monitoring the IBI over the next few months in light of recent global economic head winds, including spiking oil prices and geopolitical uncertainty. Thus far, the impact of these events on the global supply chain has been minimal, and the index continues to indicate that inventory growth and demand are indeed accelerating.
Appendix:
Sample Correlations (since 2007 inception of the IBI)
Background
Prologis’ Industrial Business Indicator (IBI) is a proprietary monthly diffusion index that we have developed by integrating customer insights with macroeconomic data to provide leading indications of trends in the U.S. industrial real estate sector, including:
- strength and direction of our customers’ businesses;
- directional trend of the overall economy; and
- demand for distribution and industrial space
After two years of internal testing we formally launched the IBI in the fourth quarter of 2009, making the index available for our customers, shareholders, investors and other key stakeholders.
Building the Index
Each month, we collect data from a geographically diverse set of customers, representing a variety of business sectors and markets, currently moving inventory through the global supply chain. With this data, we then construct two indices: an overall business activity index; and a distribution space utilization index tabulated by markets and industry groups within our customer base.
What It Tells Us
There is compelling, statistical evidence that the Prologis IBI is a leading indicator of U.S. and local economic and market conditions (see Sample Correlations above). Monthly changes in the trend line of the index are useful for identifying turning points in business activity and space utilization, as well as relative changes between markets and among industry groups.
About the Author
David C. Twist is Vice President, Research, for Prologis, responsible for the company’s global research initiatives. He has been in real estate-related research since 1990. Twist is a member of the National Association of Industrial & Office Properties (NAIO P) and the CFA Institute. He received a bachelor’s degree in quantitative economics from the University of California, San Diego.
Contribution by
Erik Gilliland is a Director, Research, for Prologis. He has been in real-estate-related research since 1998 and holds a master’s degree in economics from West Virginia University.
About Prologis
Prologis, Inc., is a leading owner, operator and developer of industrial real estate, focused on global and regional markets across the Americas, Europe and Asia. As of March 31, 2011, on a pro forma basis giving effect to the merger, Prologis owned or had investments in, on a consolidated basis or through unconsolidated joint ventures, properties and development projects expected to total more than 600 million square feet (55.7 million square meters) in 22 countries. The company leases modern distribution facilities to more than 4,500 customers, including manufacturers, retailers, transportation companies, third party logistics providers and other enterprises.
