PROLOGIS RESEARCH FORECASTS 2014 NET ABSORPTION OF 225 MILLION SQUARE FEET
Prologis’ Industrial Business Indicator (IBI), the company’s proprietary survey of customer activity levels and facility utilization rates, reveals the logistics market has maintained momentum despite volatile economic conditions in the first quarter. Our customers report that their businesses achieved another record level of activity in the first quarter and their utilization of existing space remains above average. Along with the IBI, incoming logistics market and economic data signal that demand is outpacing supply. We maintain our view of 225M sf of net absorption and 110-115M sf of completions in 2014, with the favorable supply/demand imbalance pushing vacancy to 15-year lows.
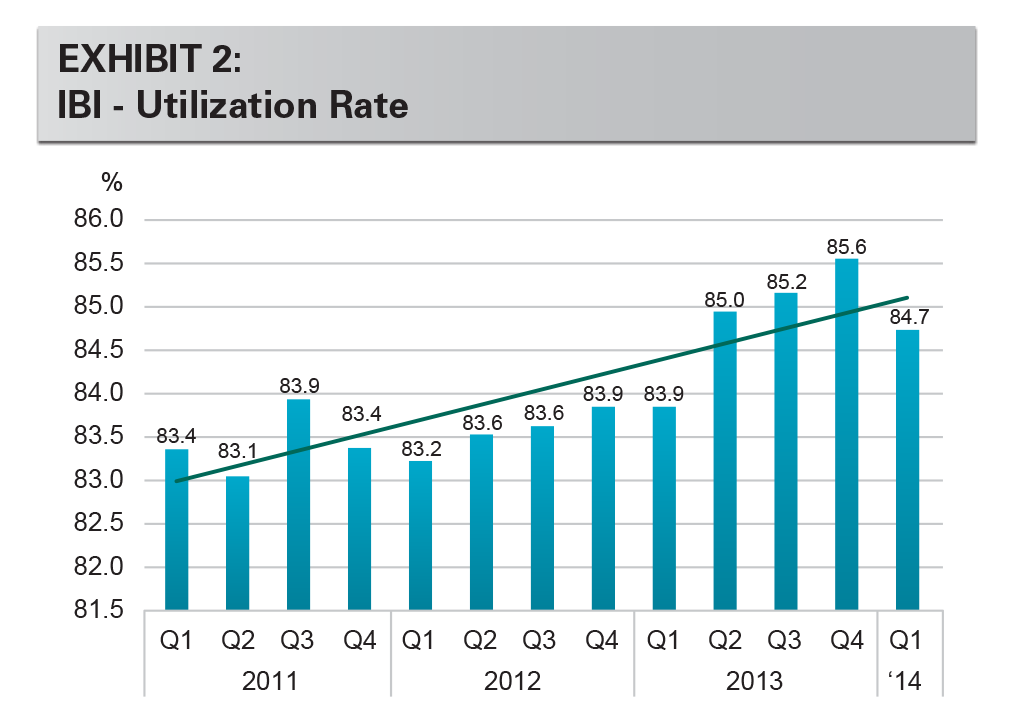
Our IBI survey indicates that customer activity levels continue to achieve new heights. The IBI index achieved an all-time high result of 66.3 in March before adjusting for seasonality. The IBI is a diffusion index, where results above 50 indicate expansion. As other macroeconomic indicators have shown, the IBI survey results signal that business momentum is improving after the cold weather in the first quarter. For example, IBI results in the East were soft earlier in the year but rose in April, as delayed demand uncoiled into activity. At the same time, our survey indicates the utilization rate of existing space remains above average and continues to trend higher, leaving little unused space to accommodate further business growth.
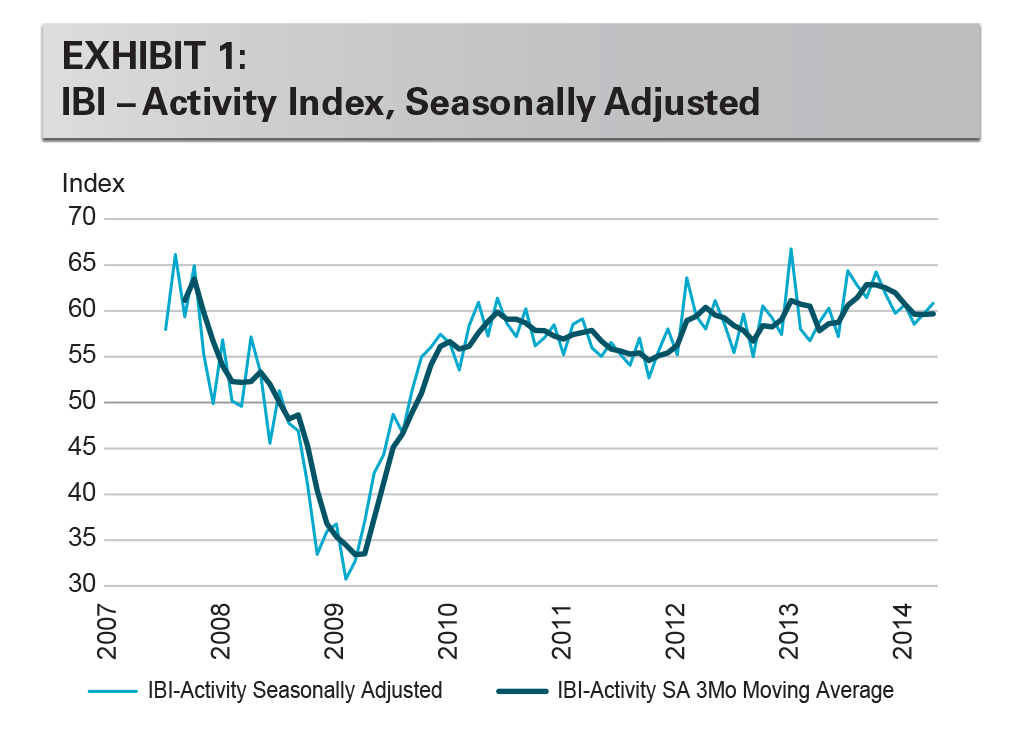
Introducing seasonal adjustment. We now have enough survey history to estimate seasonal adjustments. The IBI survey debuted in 2007, but seasonal patterns were masked by the global financial crisis until 2010. Seasonal adjustment allows for meaningful comparisons between months throughout the year. The seasonally adjusted index more clearly shows the midsummer slowdowns in 2011 and 2012 and the jump in activity throughout 2013. Among recent trends, the IBI Activity Index improved in April to a five-month high, continuing its multiyear positive trend.
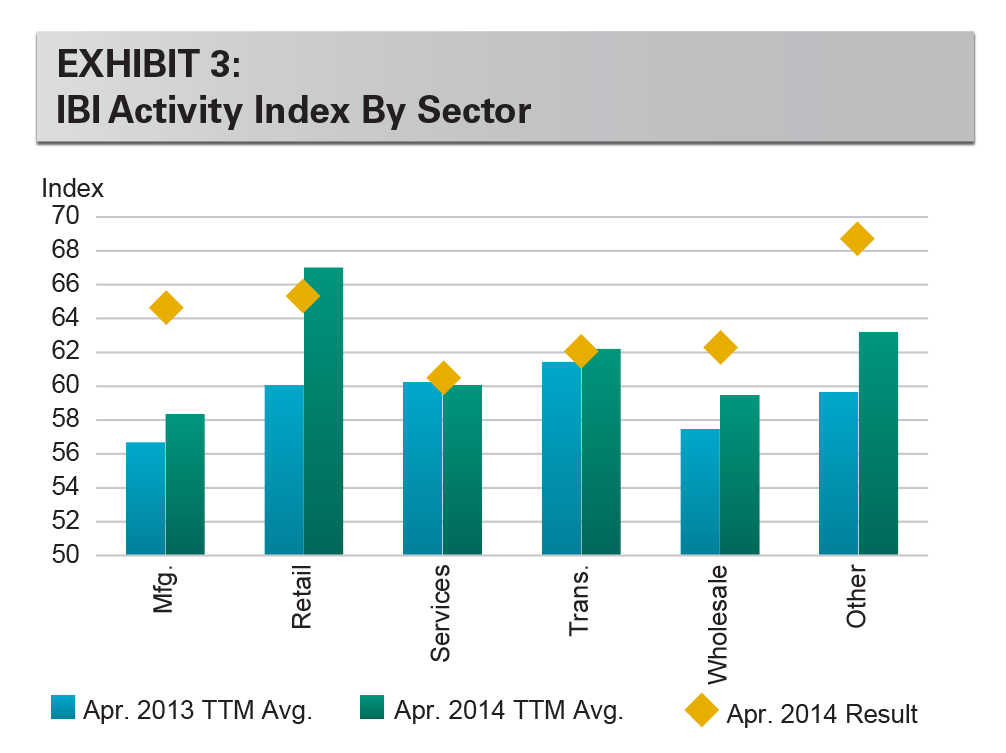
The strong IBI result is broad-based among customer industries. In both March and April, each of the six industry verticals tracked by the IBI had readings above 60, with the strongest results in the retail sector. This unprecedented result reflects the growing diversity of the economic expansion in the United States. In addition, as we discussed in a recent white paper, ”The Growth of Logistics Real Estate: An Analysis of Demand by Leading Customer Industries”, we see notable logistics demand among housing-related and auto-related industries. Within our survey, manufacturing has been a notable standout recently, rising +12 points in the past six months.
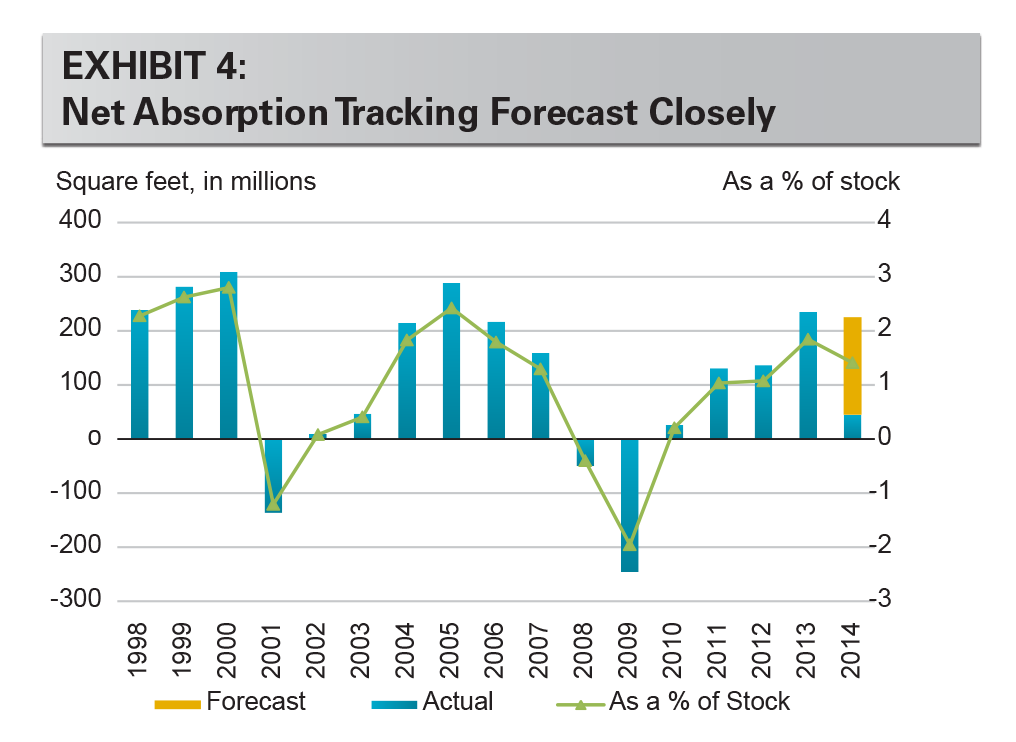
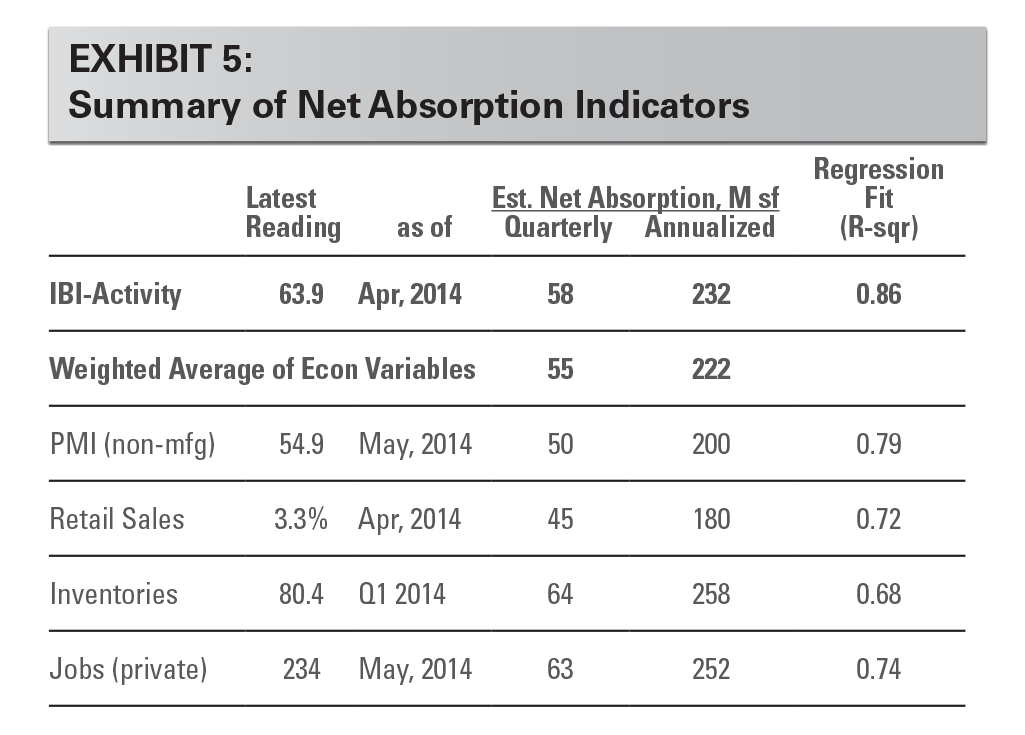
We maintain our annual net absorption forecast of 225M sf (1.8% of stock) during 2014. Net absorption in the first quarter, which is typically the lightest of the four quarters during the year due to seasonality, was 45M sf (0.4%), according to CBRE-EA. Excluding 2013, this was the strongest first quarter of demand since 2005. Exhibit 5 presents key figures and implications for net absorption. Several indicators have been weighed down by older data from the winter months. Looking ahead, the U.S. economy is quickly regaining momentum. Improving job growth is translating into firming consumer confidence and spending. Retail sales growth in March was the best in four years. We expect these individual economic-based forecasts to improve as the more recent, stronger data replace first-quarter data in our models.
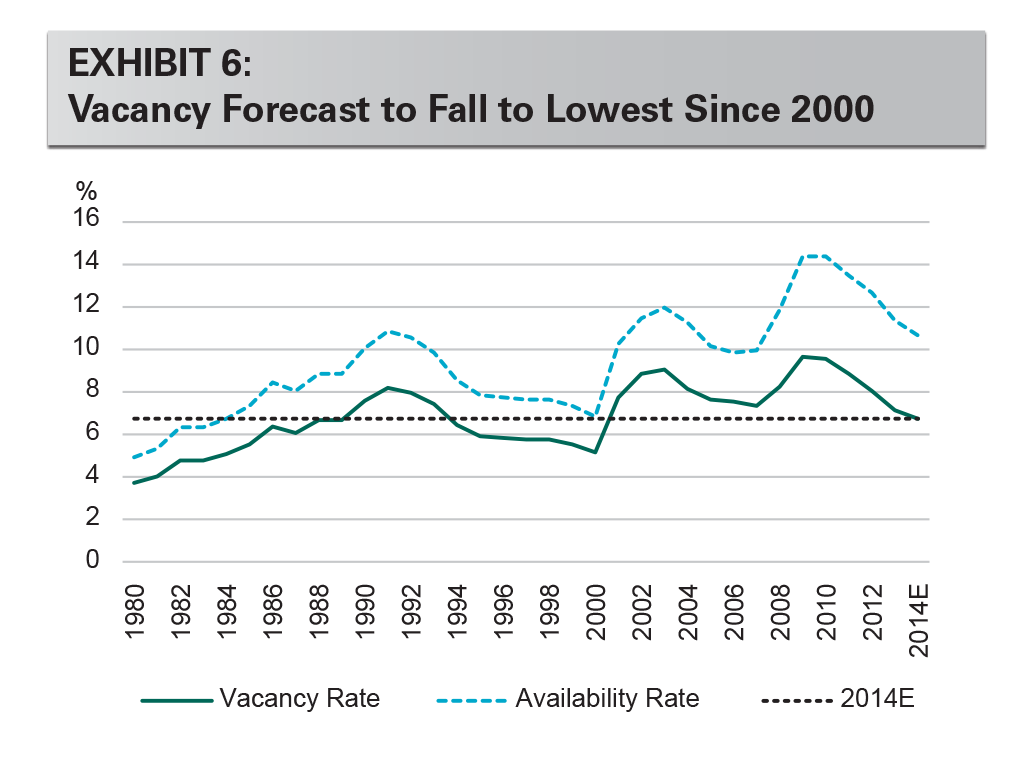
Vacancy rates, already at their lowest level since 2000, will continue to decline, in our view. Completions in the first quarter amounted to 25M sf (0.2% of stock) and we expect 110-115M sf (0.9%) in total this year, half the pace of net absorption. The current under-construction pipeline is approximately 110M sf, as of the first quarter, according to CBRE-EA, and we expect roughly 85% of it to deliver this year (~90M sf). Notably, the pipeline is concentrated in a handful of markets and is predominantly composed of larger assets. Following years of exceptionally low levels of construction, Dallas and Southern California have had the strongest demand in the past year and now have the greatest share of the construction pipeline. Amid this rising supply backdrop, it is important to consider two factors. First, new demand remains well ahead of new supply. Vacancy rates are continuing to decline, although we monitor market-level conditions closely for signs of overbuilding as the cycle progresses. Second, vacancy rates have fallen to their lowest level in more than a decade, which supports strong rental rate pricing power, and which will require more development in time to reach stabilized market vacancy rates.
CONCLUSION
Real time data further bolsters our confidence in our outlook for demand to run at roughly twice the pace of new supply this year. The leading indicators of logistics demand are brightening, with warmer weather already providing positive surprises in recent economic data. Our newly seasonally adjusted IBI series gives better comparisons month to month and allows for greater insights into the pace of demand within U.S. logistics. Our survey shows activity continues to expand and that utilization is high. Net absorption will benefit as pent-up demand uncoils. We expect low market vacancies will continue to support healthy rent growth in many U.S. markets.
Forward-Looking Statements
This material should not be construed as an offer to sell or the solicitation of an offer to buy any security. We are not soliciting any action based on this material. It is for the general information of customers of Prologis.
This report is based, in part, on public information that we consider reliable, but we do not represent that it is accurate or complete, and it should not be relied on as such. No representation is given with respect to the accuracy or completeness of the information herein. Opinions expressed are our current opinions as of the date appearing on this report only. Prologis disclaims any and all liability relating to this report, including, without limitation, any express or implied representations or warranties for statements or errors contained in, or omissions from, this report.
Any estimates, projections or predictions given in this report are intended to be forward-looking statements. Although we believe that the expectations in such forward-looking statements are reasonable, we can give no assurance that any forward-looking statements will prove to be correct. Such estimates are subject to actual known and unknown risks, uncertainties and other factors that could cause actual results to differ materially from those projected. These forward-looking statements speak only as of the date of this report. We expressly disclaim any obligation or undertaking to update or revise any forward-looking statement contained herein to reflect any change in our expectations or any change in circumstances upon which such statement is based.
No part of this material may be copied, photocopied, or duplicated in any form by any means or redistributed without the prior written consent of Prologis.
Prologis Research
Prologis’ research department studies fundamental and investment trends and Prologis’ customers’ needs to assist in identifying opportunities and avoiding risk across four continents. The team contributes to investment decisions and long-term strategic initiatives, in addition to publishing white papers and other research reports. Prologis publishes research on the market dynamics impacting Prologis’ customers’ businesses, including global supply chain issues and developments in the logistics and real estate industries. Prologis’ dedicated research team works collaboratively with all company departments to help guide Prologis’ market entry, expansion, acquisition and development strategies.
About Prologis
Prologis, Inc., is the leading owner, operator and developer of industrial real estate, focused on global and regional markets across the Americas, Europe and Asia. As of March 31, 2014, Prologis owned or had investments in, on a consolidated basis or through unconsolidated joint ventures, properties and development projects totaling approximately 574 million square feet (53.3 million square meters) in 21 countries. The company leases modern distribution facilities to more than 4,700 customers, including manufacturers, retailers, transportation companies, third-party logistics providers and other enterprises.
Copyright © 2014 Prologis, Inc. All rights reserved.
