PROLOGIS INDUSTRIAL BUSINESS INDICATOR™
Customer activity in logistics real estate continues to rise, with more corners of the industry characterized by greater competition for dwindling space. Prologis’ proprietary index of customer activity levels, the U.S. Industrial Business Indicator™ (IBI), posted another elevated reading in July, marking the 34th consecutive month of activity in the growth range. Indeed, Prologis anticipates an outsized year of new demand, forecasting a total of 250 million square feet of net absorption in 2015. Supply continues to lag demand, and is expected to total 165 million square feet of completions in 2015, pushing the market vacancy rate down to 5.9% by year-end. Tight market conditions are forcing customers to act sooner and more decisively, creating upward pressure on rental rates.
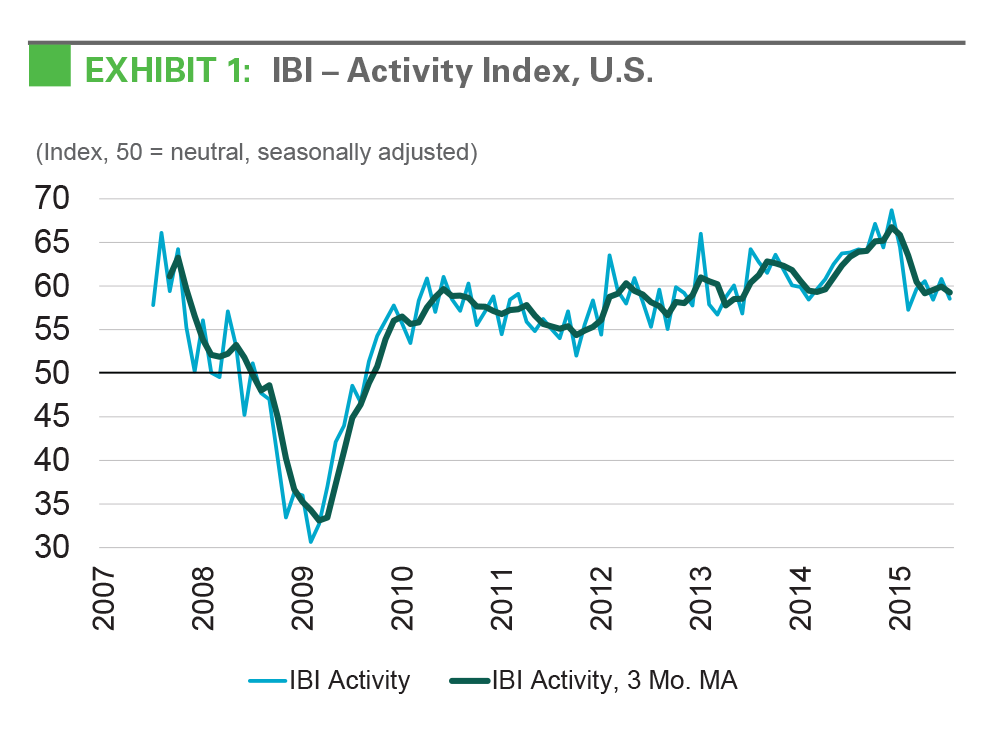
Customer demand is solid. The IBI is a proprietary survey of Prologis customer activity and facility use. In July, the seasonally adjusted IBI activity index registered 58.5, down slightly from 60.8 in June. Although the IBI has bounced back from a weak first quarter, readings are not yet back to levels recorded in late 2014. IBI readings in the high-50s indicate normal expansionary activity whereas figures in the 60s indicate an outsized expansion. Given the pace of net absorption, Prologis Research does not believe the slight decrease in the IBI is the start of secular downward trend. Still, we will monitor results closely in the coming months.
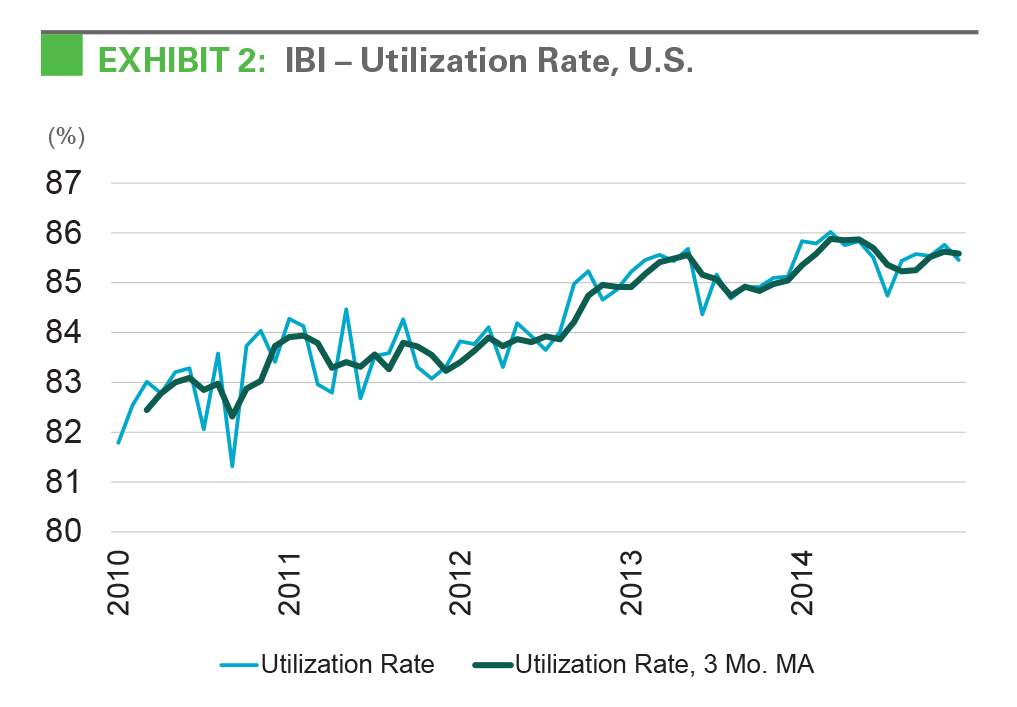
Utilization rates are elevated, driving new leasing. Customer utilization rates were essentially unchanged from prior months, hovering near peak levels at 85.5 in July. With rates peaking, increased customer activity levels are leading more directly to growth requirements and new leasing. Utilization rates are above normal and might decline in the coming years as customers ensure efficiency in their operations, which in turn could drive incremental leasing requirements.
All regions are following a similar pattern. While in the normal range for an expansion period, IBI readings ticked down slightly for all four U.S. regions in July from the prior month. The East region reported the strongest reading, at 60.2, and the Northwest region reported the weakest reading, at 54.2. All readings greater than 50 reflect healthy activity. A national trend could be the driving force behind softening in the IBI, given that all regions weakened simultaneously. With reports of lingering effects from the port disruptions on the West Coast earlier this year, we expect to see lasting shifts in the supply chain reflected in the IBI regional indices in the coming quarters.
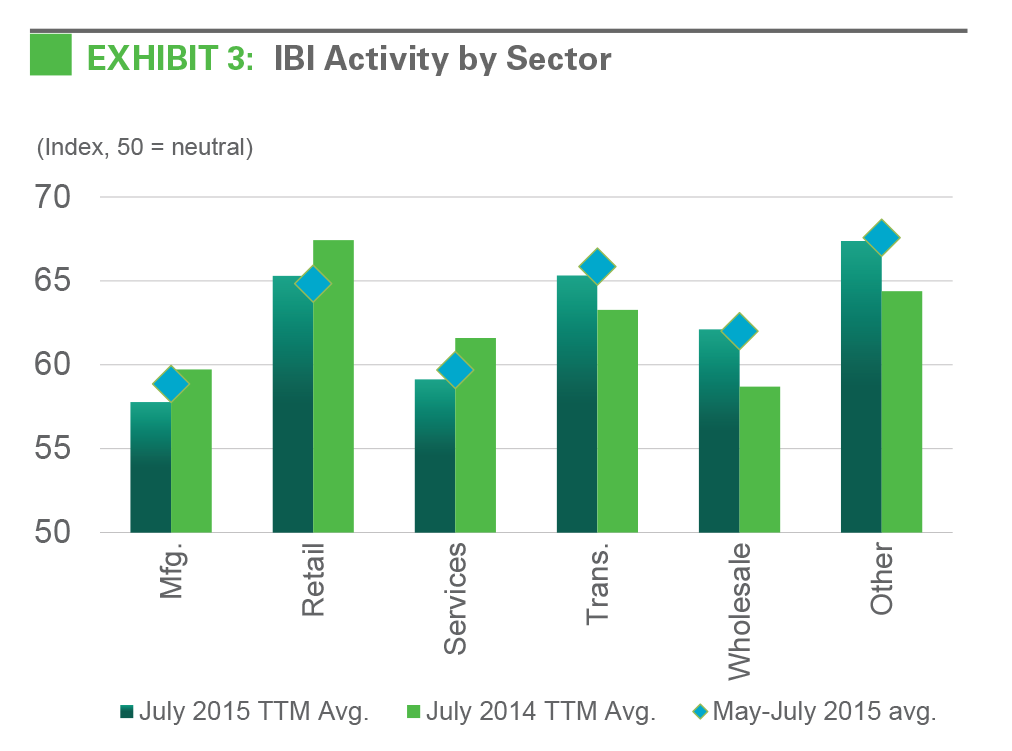
Industry-level trends diverged in recent months. Readings from Prologis customers in the retail, wholesale and transportation industries have trended upward, while readings from customers in the manufacturing sector have generally weakened thus far in 2015. Readings from customers in the services and other industry categories have been fairly stable. The survey asks customers to compare current conditions to a year prior and, given the impact of the stronger U.S. dollar and the weakening economies of some major trading partners, softer conditions in manufacturing are not surprising. At the same time, elevated confidence and increased spending has fueled domestic demand for consumer goods, boosting activity for consumer-driven industries. With the exception of manufacturing, which posted its first neutral reading in 43 months, all Prologis-served industries reflected activity in line with expansion during July.
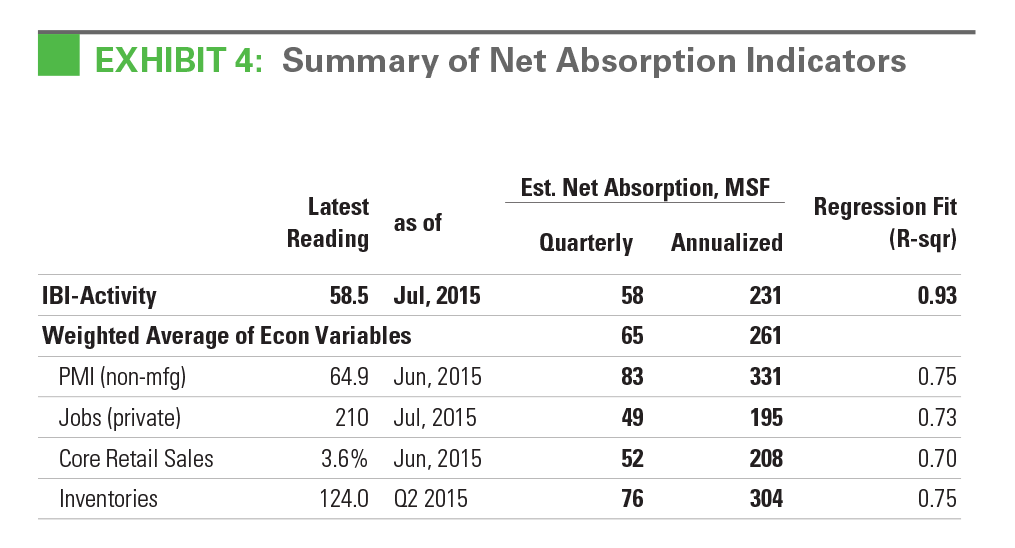
Economic data demonstrate a foundation for continued growth. Outside of a few isolated pockets, U.S. economic indicators have reflected healthy growth through the second quarter, in line with net absorption of 261 million square feet (see Exhibit 4). On the margin, our econometric process, which includes an autoregressive component, likely has a slight upward and temporary bias of 10-20 million square feet related to the outsized pace of absorption in the second quarter. Nonetheless, economic expansion is being broadly felt through industries and geographies. Although month-to- month volatility has existed in variables such as retail sales, other indicators tell a largely positive story. One example is personal consumption expenditures, which increased at a 2.9% annual pace in the second quarter.1 Another example is employment growth, which has been steady and moderate, adding an average of about 200,000 jobs per month2 and leading to a progressive tightening of labor market conditions. Wage growth, however, has lagged expectations. While Prologis will continue to monitor these indicators, we believe inconsistencies will ultimately reconcile as long as economic fundamentals, including a growing national product, job creation and access to credit, continue to improve. Looking forward, deleveraged household finances, rising employment, wage growth and low oil prices all point to further increases in consumer confidence and spending, which should produce a virtuous cycle and drive demand in a host of other industries.
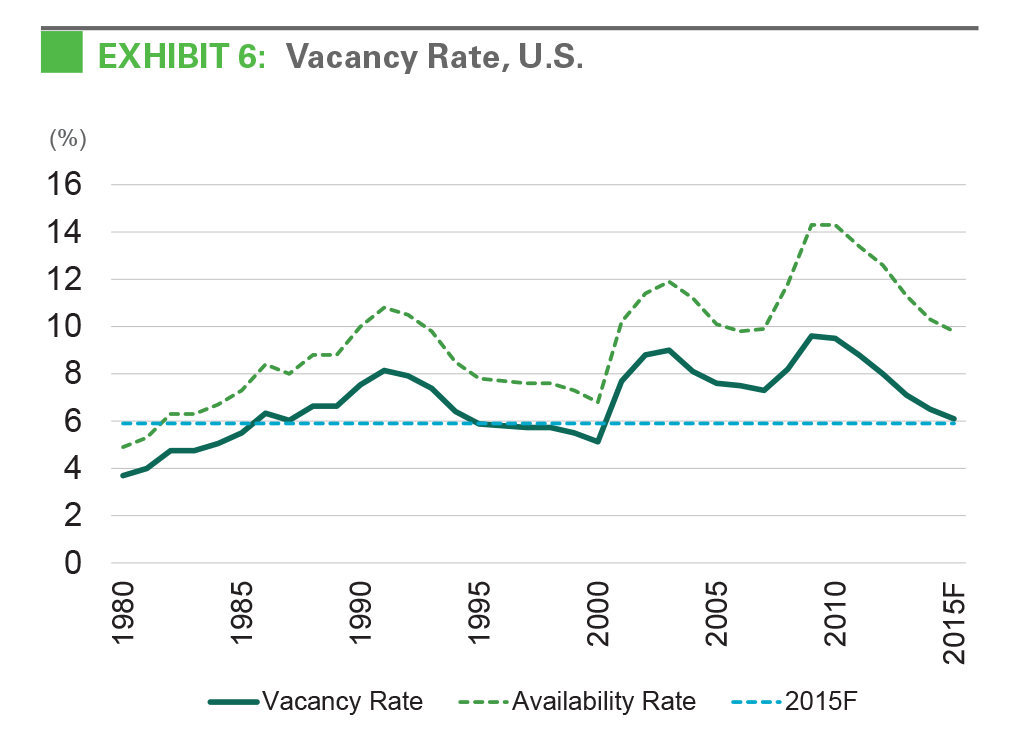
Supply is rising in response to demand. Vacancy rates have fallen to 15-year or, in some cases, all-time lows in a broad range of U.S. markets. Logistics real estate customers are finding it increasingly difficult to secure space that fits their needs, and many are negotiating renewals well ahead of lease expiration to lock in rental rates. Given this lack of vacant, high-quality space and the continued evolution of customer needs, a rise in new construction is warranted to fulfill pent-up demand for space. Although new construction was concentrated in a handful of markets during the early years of the recovery, more recently development has spread to a diverse group of markets. For example, markets such as Central and Eastern Pennsylvania, Atlanta and the Central Valley have recorded a brisk expansion of construction pipelines as vacancy rates contracted in recent quarters. Persistent strong demand has kept supply in check during the quick acceleration in construction activity.
Supply is falling, also in response to demand. Developer restraint has been a surprising facet of this cycle. The amount of space under construction in many leading markets, which also recorded the earliest supply responses, has decreased relative to 2014, particularly where vacancy rates had begun to move upward. Examples include Dallas, Houston, Indianapolis and Phoenix. This trend is even more pronounced when examined on a size category level within each market, such as the decline in starts for larger facilities in these markets. Several drivers could be promoting better balance during this cycle, including increased availability of data, a more conservative lending environment and rising construction costs, among others.
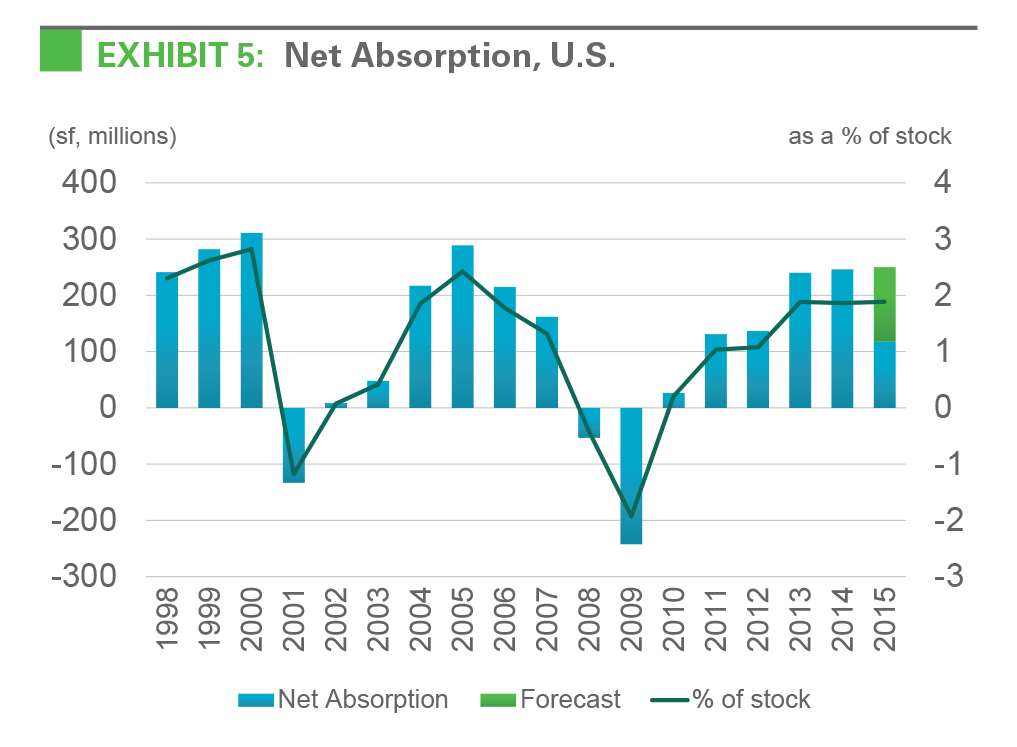
The outlook is positive through the near term and likely beyond. The combination of structural shifts in supply chains, such as the establishment of e-commerce, and a lengthy cyclical expansion period has bolstered demand for logistics real estate. At the same time, dynamics in the construction side of the business have aligned to produce what seems to be a more sensitive and conservative supply response. With IBI readings and economic data pointing to further growth, Prologis expects the supply shortage to become more pronounced. We forecast net absorption to continue to outpace new supply, with 250 million square feet of net absorption in 2015 versus 165 million square feet of completions. In addition, given the moderate pace of starts so far in 2015, we envision an additional year of demand in excess of supply. Our initial outlook for 2016 anticipates a normal year of demand (225 million square feet of net absorption) along with a still-lower pace of completions (215 million square feet). This imbalance should result in a continued decline in the vacancy rate to 5.9% at year-end and 5.8% in 2016. This decline is likely to manifest in an acute lack of available facilities across more markets and size categories, in which case sourcing facilities will remain a challenge.
FOOTNOTES
- Bureau of Economic Analysis
- Bureau of Labor Statistics
FORWARD LOOKING STATEMENTS
This material should not be construed as an offer to sell or the solicitation of an offer to buy any security. We are not soliciting any action based on this material. It is for the general information of customers of Prologis.
This report is based, in part, on public information that we consider reliable, but we do not represent that it is accurate or complete, and it should not be relied on as such. No representation is given with respect to the accuracy or completeness of the information herein. Opinions expressed are our current opinions as of the date appearing on this report only. Prologis disclaims any and all liability relating to this report, including, without limitation, any express or implied representations or warranties for statements or errors contained in, or omissions from, this report.
Any estimates, projections or predictions given in this report are intended to be forward-looking statements. Although we believe that the expectations in such forward-looking statements are reasonable, we can give no assurance that any forward-looking statements will prove to be correct. Such estimates are subject to actual known and unknown risks, uncertainties and other factors that could cause actual results to differ materially from those projected. These forward-looking statements speak only as of the date of this report. We expressly disclaim any obligation or undertaking to update or revise any forward-looking statement contained herein to reflect any change in our expectations or any change in circumstances upon which such statement is based.
No part of this material may be (i) copied, photocopied, or duplicated in any form by any means or (ii) redistributed without the prior written consent of Prologis.
PROLOGIS RESEARCH
Prologis’ research department studies fundamental and investment trends and Prologis’ customers’ needs to assist in identifying opportunities and avoiding risk across four continents. The team contributes to investment decisions and long-term strategic initiatives, in addition to publishing white papers and other research reports. Prologis publishes research on the market dynamics impacting Prologis’ customers’ businesses, including global supply chain issues and developments in the logistics and real estate industries. Prologis’ dedicated research team works collaboratively with all company departments to help guide Prologis’ market entry, expansion, acquisition and development strategies.
ABOUT PROLOGIS
Prologis, Inc., is the leading owner, operator and developer of industrial real estate, focused on global and regional markets across the Americas, Europe and Asia. As of June 30, 2015, Prologis owned or had investments in, on a consolidated basis or through unconsolidated joint ventures, properties and development projects totaling approximately 670 million square feet (62 million square meters) in 21 countries. The company leases modern distribution facilities to approximately 5,200 customers, including manufacturers, retailers, transportation companies, third-party logistics providers and other enterprises.
