Prologis U.S. Industrial Business Indicator™
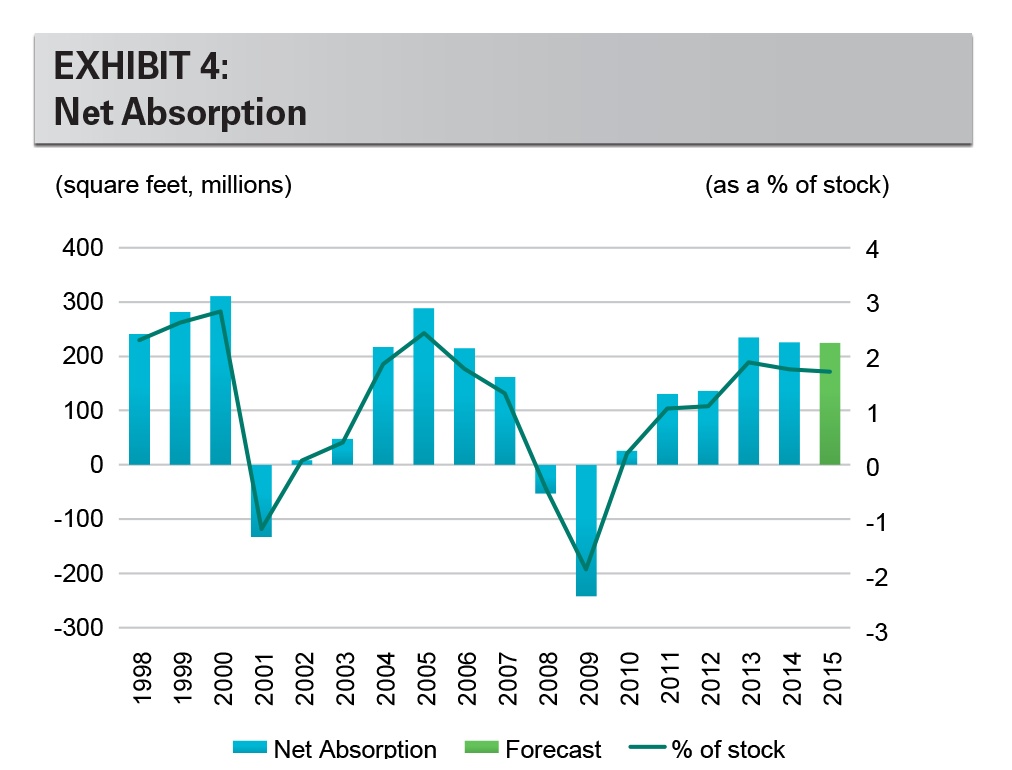
Prologis’ U.S. Industrial Business Indicator™ (IBI), the company’s proprietary survey of customer activity and facility utilization, confirms momentum in the logistics market. Net absorption was healthy in 2014, at 226 million square feet, following on the strength of 2013. Our IBI’s elevated levels illustrate that this momentum will continue into 2015. We forecast net absorption of 225 million square feet and 170 million square feet of completions this year, and the continued favorable supply/demand imbalance in 2015 is expected to push vacancies to multi-cycle lows in more markets.
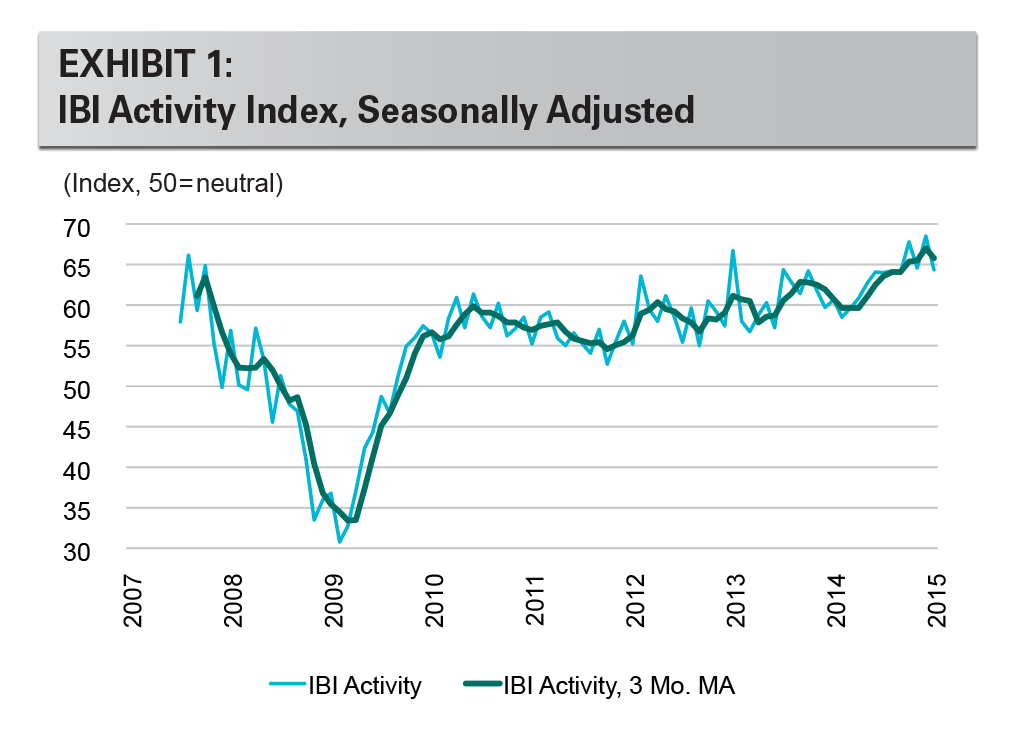
IBI results show broad industrial real estate expansion. The activity index remains elevated, reaching 64.4 in January and a three month average of 65.8. The IBI is a diffusion index; results above 50 indicate expansion. January’s result further highlights the improvement trend of the past three years. On the margin, January is down from record results in December and October, but nonetheless points to a robust U.S. expansion.
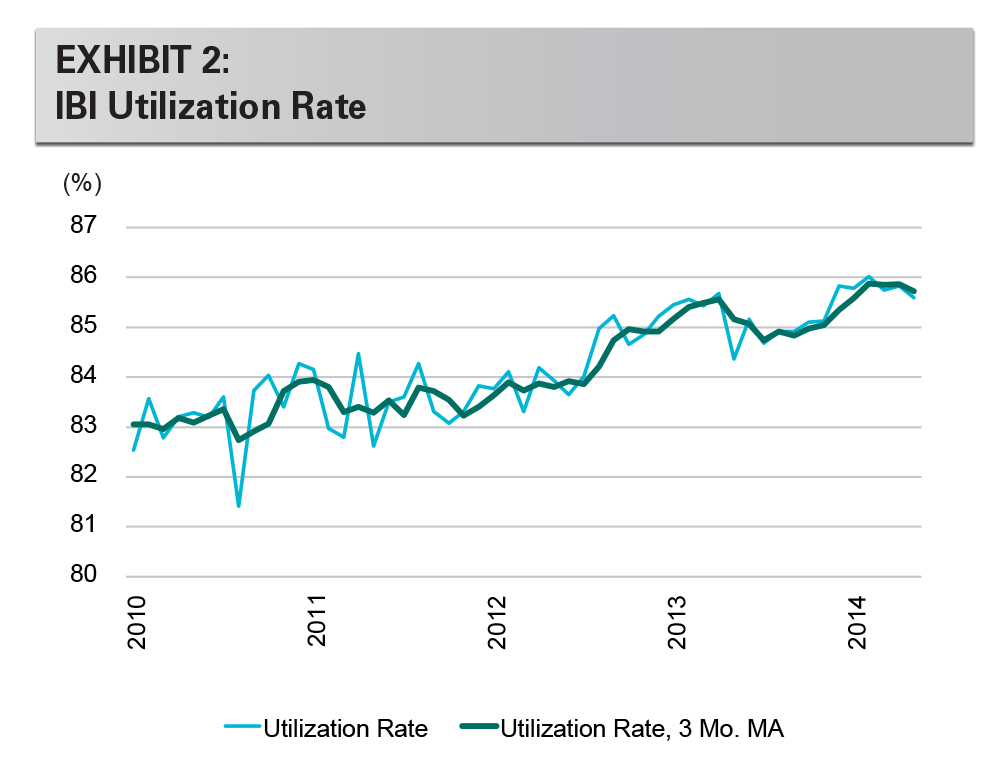
Utilization rates are near peak-levels for the current cycle. The utilization rate component of our survey remains at high levels, reaching 85.6% in January and a three month moving average of 85.7%. Against this backdrop, the peak in the utilization rate indicates that customers are increasingly leasing new space to satisfy their growth requirements, rather than growing in their existing space. Looking ahead, the utilization rate may decline further as customers balance their space requirements with business expansion. Similarly, this growth should translate to new lease activity.
All regions are expanding. Our survey illustrates upbeat results in each region of the U.S. over the past three months (all with index levels above 60). The latest IBI result confirms that economic growth supports activity across the range of markets, submarkets and product categories. Activity in the Southwest, where Southern California is the most predominant market, is among the most improved in the U.S. Outperforming regions also include those in Central and Eastern Pennsylvania and Dallas.
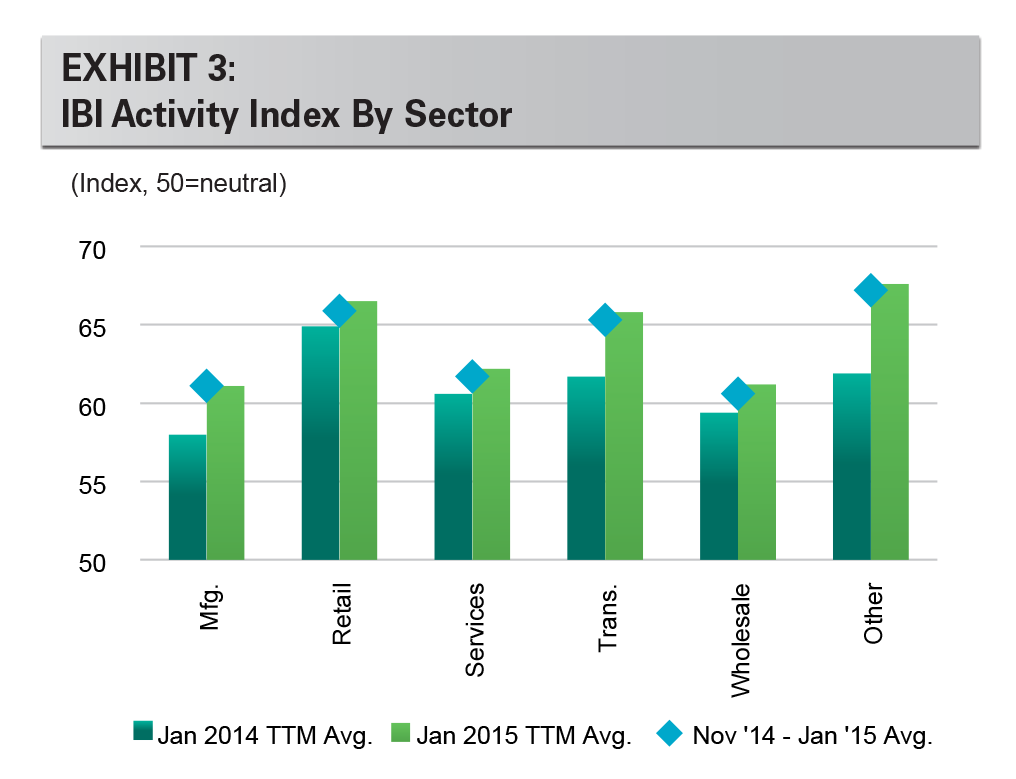
IBI results are positive for each industry served by Prologis. For the sixth consecutive month, index figures for all six industrial sectors tracked by the survey topped 60 and showed substantial growth over the prior year’s results. The strength of the index for transportation oriented customers (which includes third-party logistics providers) reflects positively on the overall logistics market.
U.S. economic growth has surged. In particular, consumer-oriented sectors have benefitted from the decline in oil prices and an upswing in business and consumer confidence. The IBI led many of these indicators higher, and we now observe strength in multiple corners of key economic variables, including PMIs (non-manufacturing), employment and inventories. Retail sales are stable thanks to improved consumer confidence, but are offset by weakness related to cheaper gas. As Exhibit 5 shows, the surge in these indicators points to considerable strength for net absorption. Collectively, the IBI and economic variable models show annual net absorption in the range of 250 million square feet (an average of the two models). Our forecast for net absorption is lower (225 million square feet for 2015), as these indicators seem unsustainably high. And, with vacancies so low, the market is running out of space to absorb.
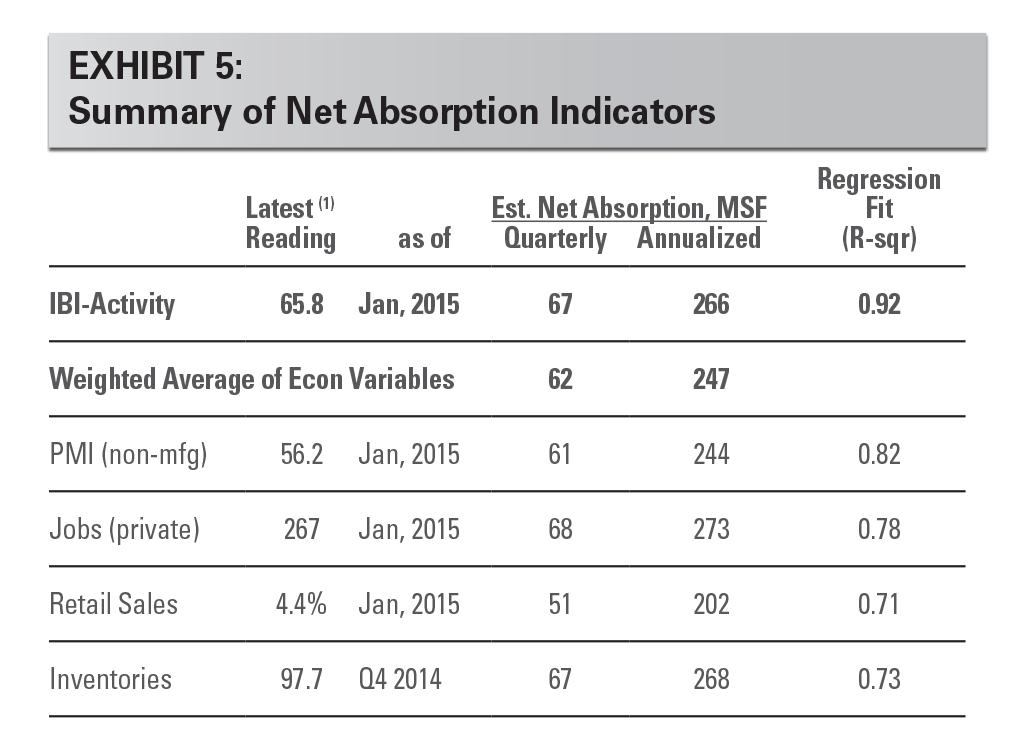
(1) Note: Based upon 15 year regression analyses, with data where available, using an auto-regressive process. IBI is the three-month moving average index level. PMI series is the three-month moving average index level. Retail sales series is the yr/yr growth of the three-month moving average. Inventories series is the two-quarter moving average in billions of real dollars (2009 basis). Jobs series is the three-month average change in private employment in thousands. The weighted average is based on R-squareds.
Vacancies are expected to decline in 2015. With another year of more than 200 million square feet of net absorption, demand for logistics real estate is healthy and could improve from 2014’s rate of 226 million square feet. Vacancy rates reached 6.5% at the end of 2014 according to CBRE Econometric Advisors, and are poised to decline further now that the demand run-rate is higher than the current supply pipeline. Reports of total stock under construction vary but the range of 130-150 million square feet is consistent with approximately 170 million square feet of deliveries. Against that backdrop, we expect vacancies to fall to the low-6% range. On the margin, the larger box category has balanced supply/demand conditions (given its earlier recovery) but is offset by a favorable supply/ demand mismatch for small- and mid-sized facilities.
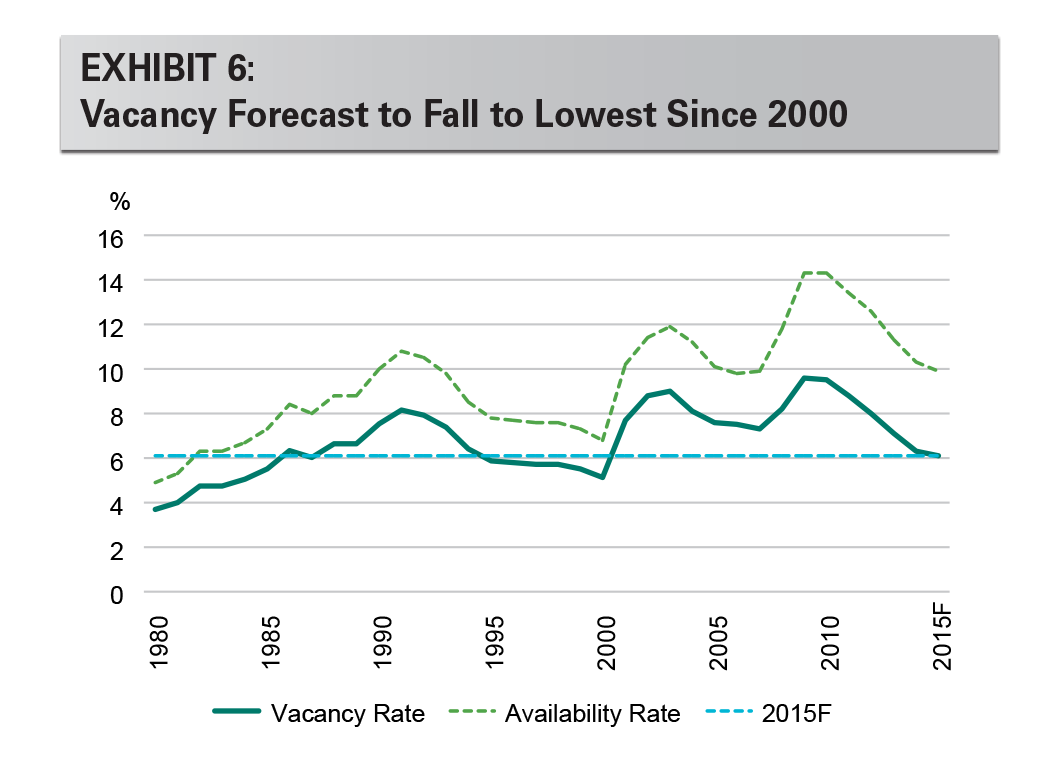
Note: 2015F is Prologis Research’s forecast. Historical vacancy and availability data comes from CBRE-EA. CBRE’s vacancy series begins in 2001. Older historic levels have been estimated based on the ratio between vacancy/availability during 2001-2007, which averaged .75/1.00.
CONCLUSION
U.S. market conditions are strong. Leading indicators of demand are elevated, revealing another year of healthy net absorption for 2015. Vacancies are poised to fall to 15-year lows as a result. And, growth is broadening. Supply and demand is generally balanced for bigger-box facilities but is offset by tightening in the market for small- and mid-sized facilities. At the same time, acceleration in the development markets has led to increases in land and construction replacement costs. This acts as a governor on construction starts.
Forward-Looking Statements
This material should not be construed as an offer to sell or the solicitation of an offer to buy any security. We are not soliciting any action based on this material. It is for the general information of customers of Prologis.
This report is based, in part, on public information that we consider reliable, but we do not represent that it is accurate or complete, and it should not be relied on as such. No representation is given with respect to the accuracy or completeness of the information herein. Opinions expressed are our current opinions as of the date appearing on this report only. Prologis disclaims any and all liability relating to this report, including, without limitation, any express or implied representations or warranties for statements or errors contained in, or omissions from, this report.
Any estimates, projections or predictions given in this report are intended to be forward-looking statements. Although we believe that the expectations in such forward-looking statements are reasonable, we can give no assurance that any forward-looking statements will prove to be correct. Such estimates are subject to actual known and unknown risks, uncertainties and other factors that could cause actual results to differ materially from those projected. These forward-looking statements speak only as of the date of this report. We expressly disclaim any obligation or undertaking to update or revise any forward-looking statement contained herein to reflect any change in our expectations or any change in circumstances upon which such statement is based.
No part of this material may be copied, photocopied, or duplicated in any form by any means or redistributed without the prior written consent of Prologis.
About Prologis
Prologis, Inc., is the leading owner, operator and developer of industrial real estate, focused on global and regional markets across the Americas, Europe and Asia. As of September 30, 2014, Prologis owned or had investments in, on a consolidated basis or through unconsolidated joint ventures, properties and development projects totaling approximately 585 million square feet (54.3 million square meters) in 21 countries. The company leases modern distribution facilities to more than 4,700 customers, including manufacturers, retailers, transportation companies, third-party logistics providers and other enterprises.
Prologis Research
Prologis’ research department studies fundamental and investment trends and Prologis’ customers’ needs to assist in identifying opportunities and avoiding risk across four continents. The team contributes to investment decisions and long-term strategic initiatives, in addition to publishing white papers and other research reports. Prologis publishes research on the market dynamics impacting Prologis’ customers’ businesses, including global supply chain issues and developments in the logistics and real estate industries. Prologis’ dedicated research team works collaboratively with all company departments to help guide Prologis’ market entry, expansion, acquisition and development strategies.
Copyright © 2015 Prologis, Inc. All rights reserved.
