World events trigger soft patch
The global economic soft patch in the first half of 2011 was primarily caused by the cost of oil reaching $114 per barrel, rising commodity prices, the mounting debt crises in Europe and the United States, and the twin disasters in Japan, which interrupted supply chains as well as business and consumer confidence. However, despite these headwinds, net absorption of logistics space in the United States in the second quarter was 26 million square feet, the strongest second quarter in four years.
While economic growth was moderate in the U.S. in first half of the year (less than 1% annualized), the industrial market outperformed relative to economic growth by delivering 55 million square feet of net absorption. At the time of this writing, we continue to expect a stronger second half of the year for the global economy, trade, inventories and ultimately logistics real estate, followed by even stronger annual growth in 2012.
Relationship between demand and global trade intact
In June 2009, at the trough of the global financial and economic crises, in our paper titled “The Long- Term Prospects for Global Trade and Industrial Real Estate Demand,” our research indicated that the relationship between the demand for logistics real estate and global trade remained intact, and that trade along with GDP, consumption and inventories would recover cyclically as they had in the past. Our proprietary research also indicated that the impending recovery in trade would lead to a rebound in the demand for logistics and distribution centers around the world. This line of thinking went against the grain of many people following our industry. We reaffirmed our thesis in a November 2010 piece called “Driving Change in the Global Supply Chain: The Inventory Story,” demonstrating that GDP, consumption and trade were on course to make an almost perfect “V” shaped recovery (albeit across a broad time frame of almost three years). Currently, U.S. trade is leading the other indicators into expansionary territory, as illustrated in Exhibit 1.
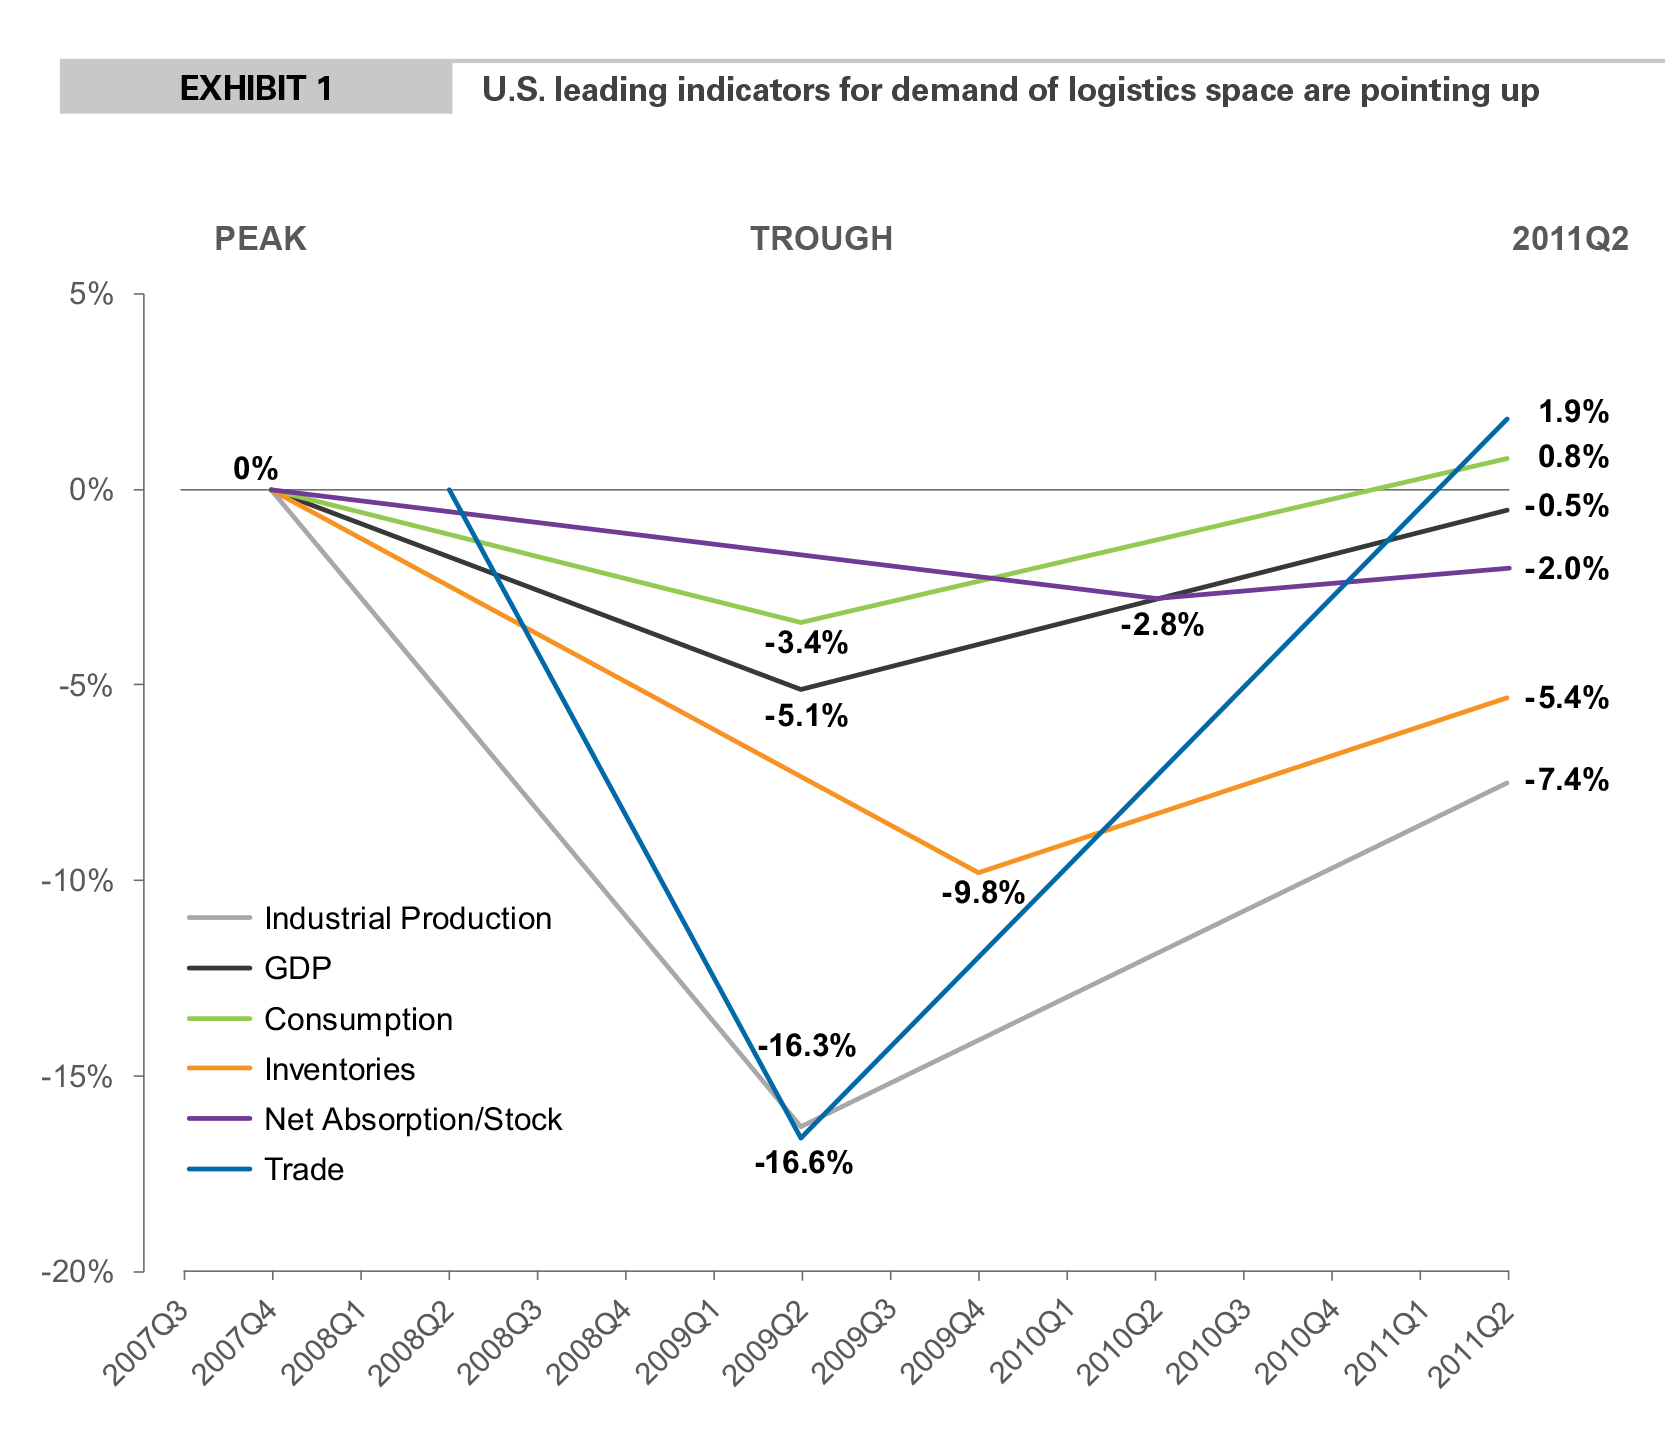
Recent revisions from The Bureau of Economic Analysis indicate that the recession was deeper and therefore the recovery will be slower than previously reported. However, the same data confirms that the structural relationship between drivers and demand remains unchanged, and that a cyclical recovery is still underway. For example, U.S. consumption is past its pre-recession peak level and still growing as the nation has increased its population by more than 10 million since the beginning of the downturn. Real trade is almost 2% past its pre-crisis peak, fueled by rising consumption and record levels of exported goods. Imports in the first two quarters of 2011 are up more than 7% over the same period in 2010 and down just 1.4% from their previous peak level. Imports are still growing steadily and are poised to surpass their prior peak in the second half of 2011, driven by growing global consumption and trade.
Major economies rebounding in material way
Several global data points lead us to believe that a material rebound remains on track beyond U.S. borders, as well. In Mexico, for example, industrial production slipped in April but rebounded sharply in May and June. Globally, as the Japan-related disruptions to the supply chain faded, manufacturing indices and industrial production almost universally bounced back in May, although many of those same benchmarks did soften in July due to market volatility. However, rebuilding efforts in Japan are helping boost confidence and GDP in the Japanese economy.
Exhibit 2 illustrates the uneven nature of the global recovery among the major economies. China, Brazil, Canada and Mexico are past their previous GDP peaks; the United States, Germany, France and the Netherlands are following closely behind; and the UK and Japan are lagging.
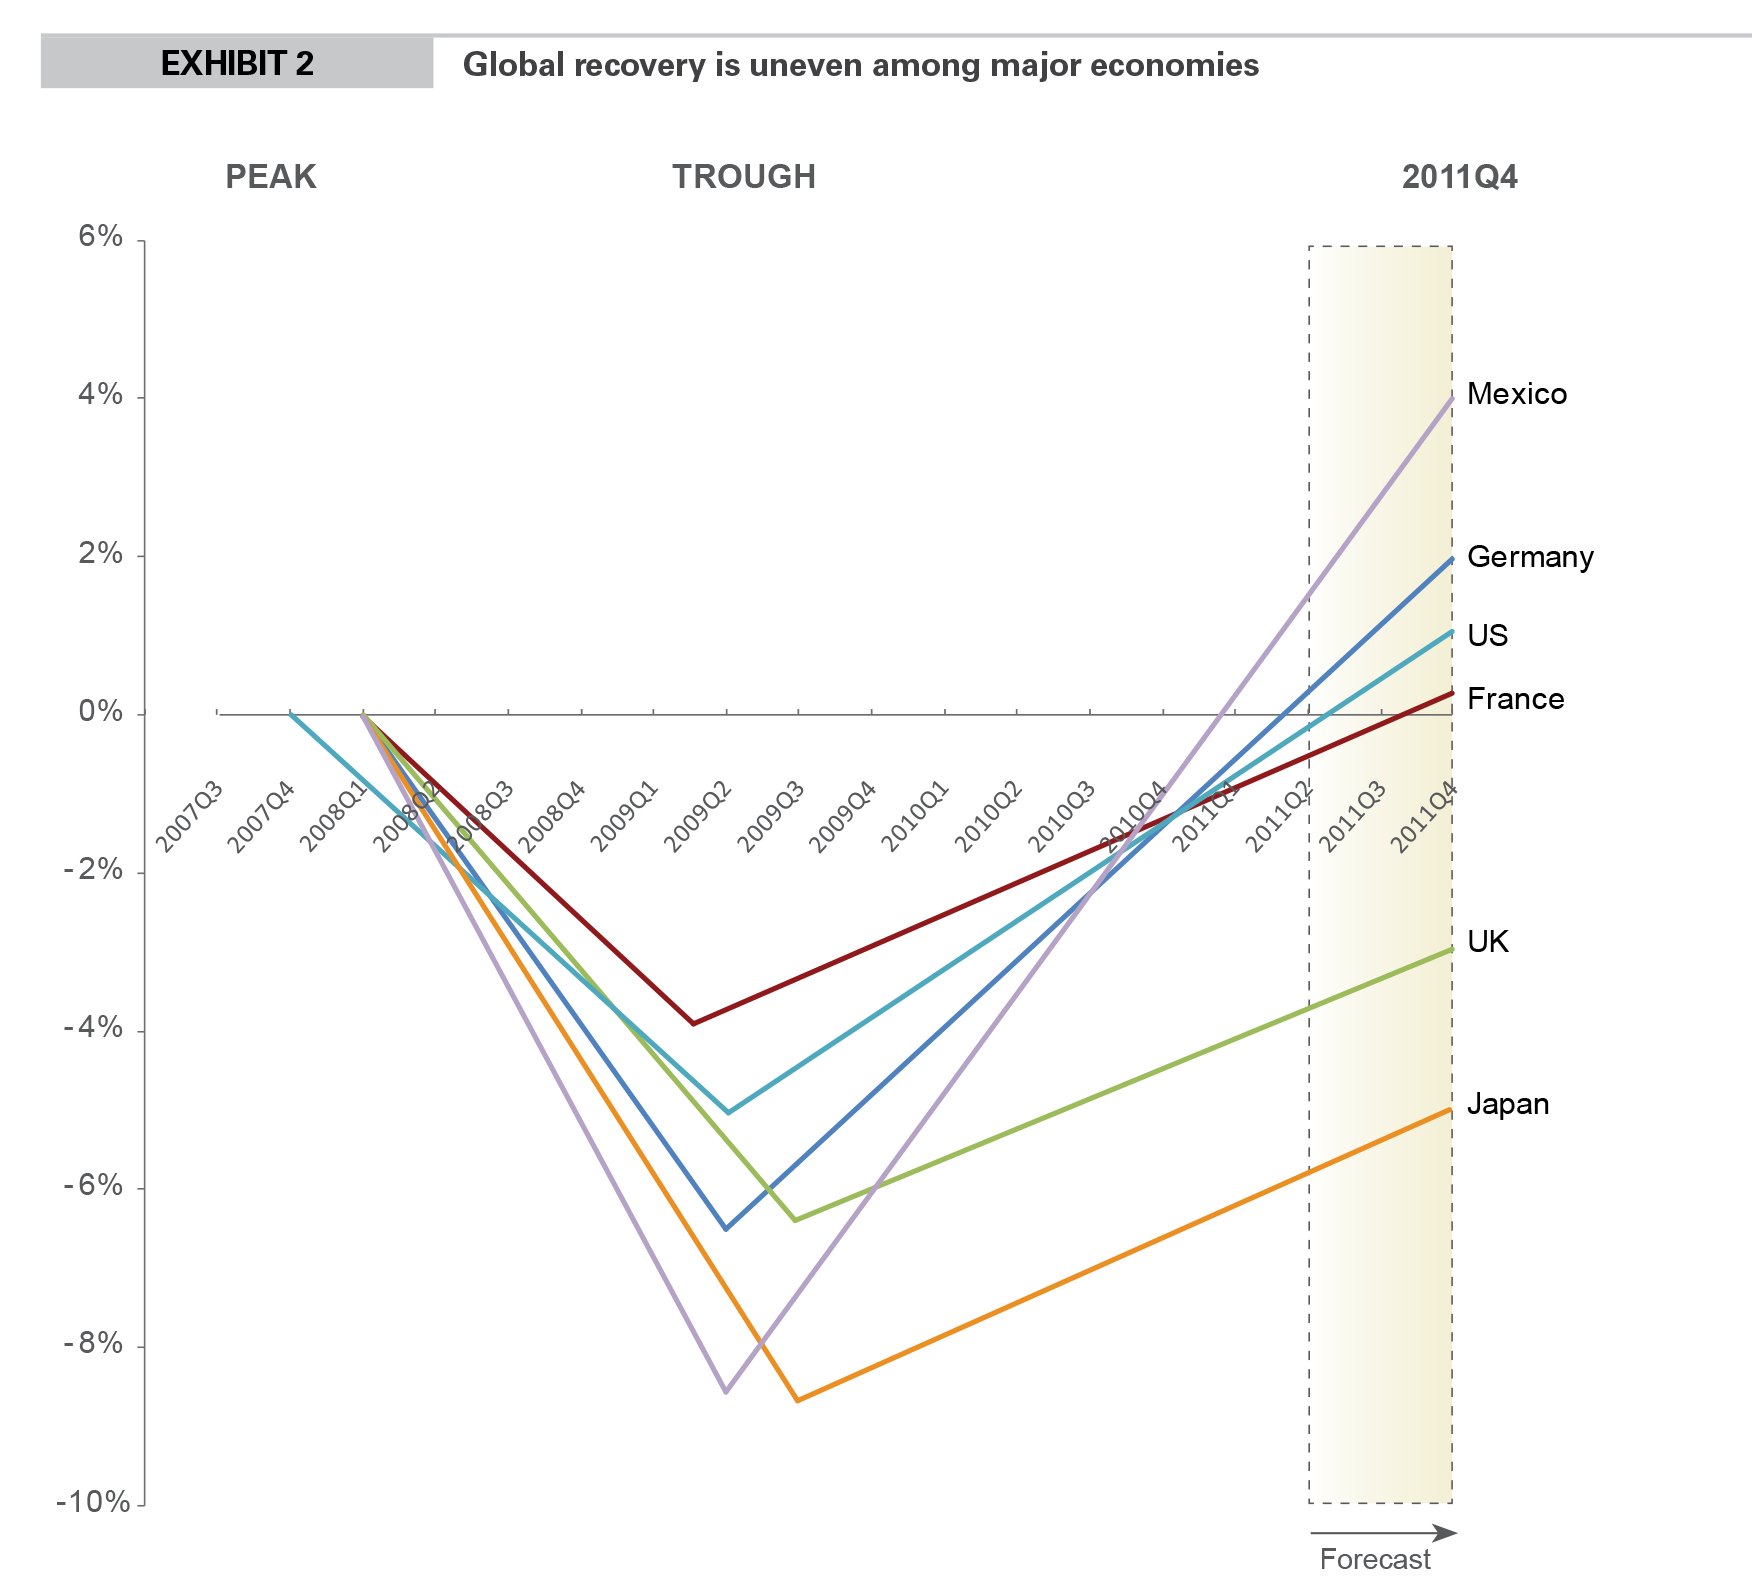
Japan suffered a major but temporary economic setback resulting from the earthquake and tsunami in March 2011, and its economy is expected to begin growing in the third quarter, with relatively robust growth of more than 3% anticipated in 2012. Evidence that the Japanese economy is already turning the corner can be found in recent data, with industrial production up 6.2% in May and 3.5% in June. Combined, this is the largest two month gain in industrial production in more than 50 years and includes a notable 36.4% gain in output in the country’s hard-hit transportation sector. Second-quarter GDP in Japan was better than expected at -0.3%.
The UK’s economy fell about the same as Germany’s, but its recovery has been much slower and more erratic than Germany’s manufacturing and export-driven recovery. The UK’s recent struggles have been attributed to its government’s harsh austerity measures to this point, but official reports imply that quantitative easing measures could be implemented if the pace of economic growth does not accelerate.
By the end of 2011, we expect that the United States, Germany, France and the Netherlands will have also surpassed pre-crisis peak levels and that the UK and Japan will have made up significant ground.
Inventories a powerful driver of the next wave of demand
Benchmark revisions to GDP reveal that inventories actually bottomed closer to 10%, further than previously indicated, but they since have made up about half of this drop. In the first two quarters of 2011, inventories were up 3.4% over the same period last year, despite slower economic growth and consumption. With U.S. trade and consumption past prior peak levels, inventories will need to grow faster — from unsustainable and near-record lows — in order to keep pace in the second half of 2011.
We know that inventories relative to sales have been trending down for decades, but it is also true that inventories have been growing over time and tend to rebound following a recession. Inventories need to grow about 4% just to return to historical trend levels. Today, inventories are approximately 4% too low, which coincidentally coincides with the amount of excess vacancy in the U.S. It’s also worth noting that inventories are rebuilding faster than either consumption or GDP.
While inventories might not return immediately to their pre-recession levels, they are now below where the economy and consumption would warrant. They are in fact growing from record low levels of inventories relative to sales. As of the second quarter, the economy has expanded for eight quarters in a row, real inventories have increased for six successive quarters and net absorption has occurred over the last four. Exhibit 3 shows a simple regression of real inventories to real GDP. The regression fit between these two series is strong, with an R2 of 0.9.
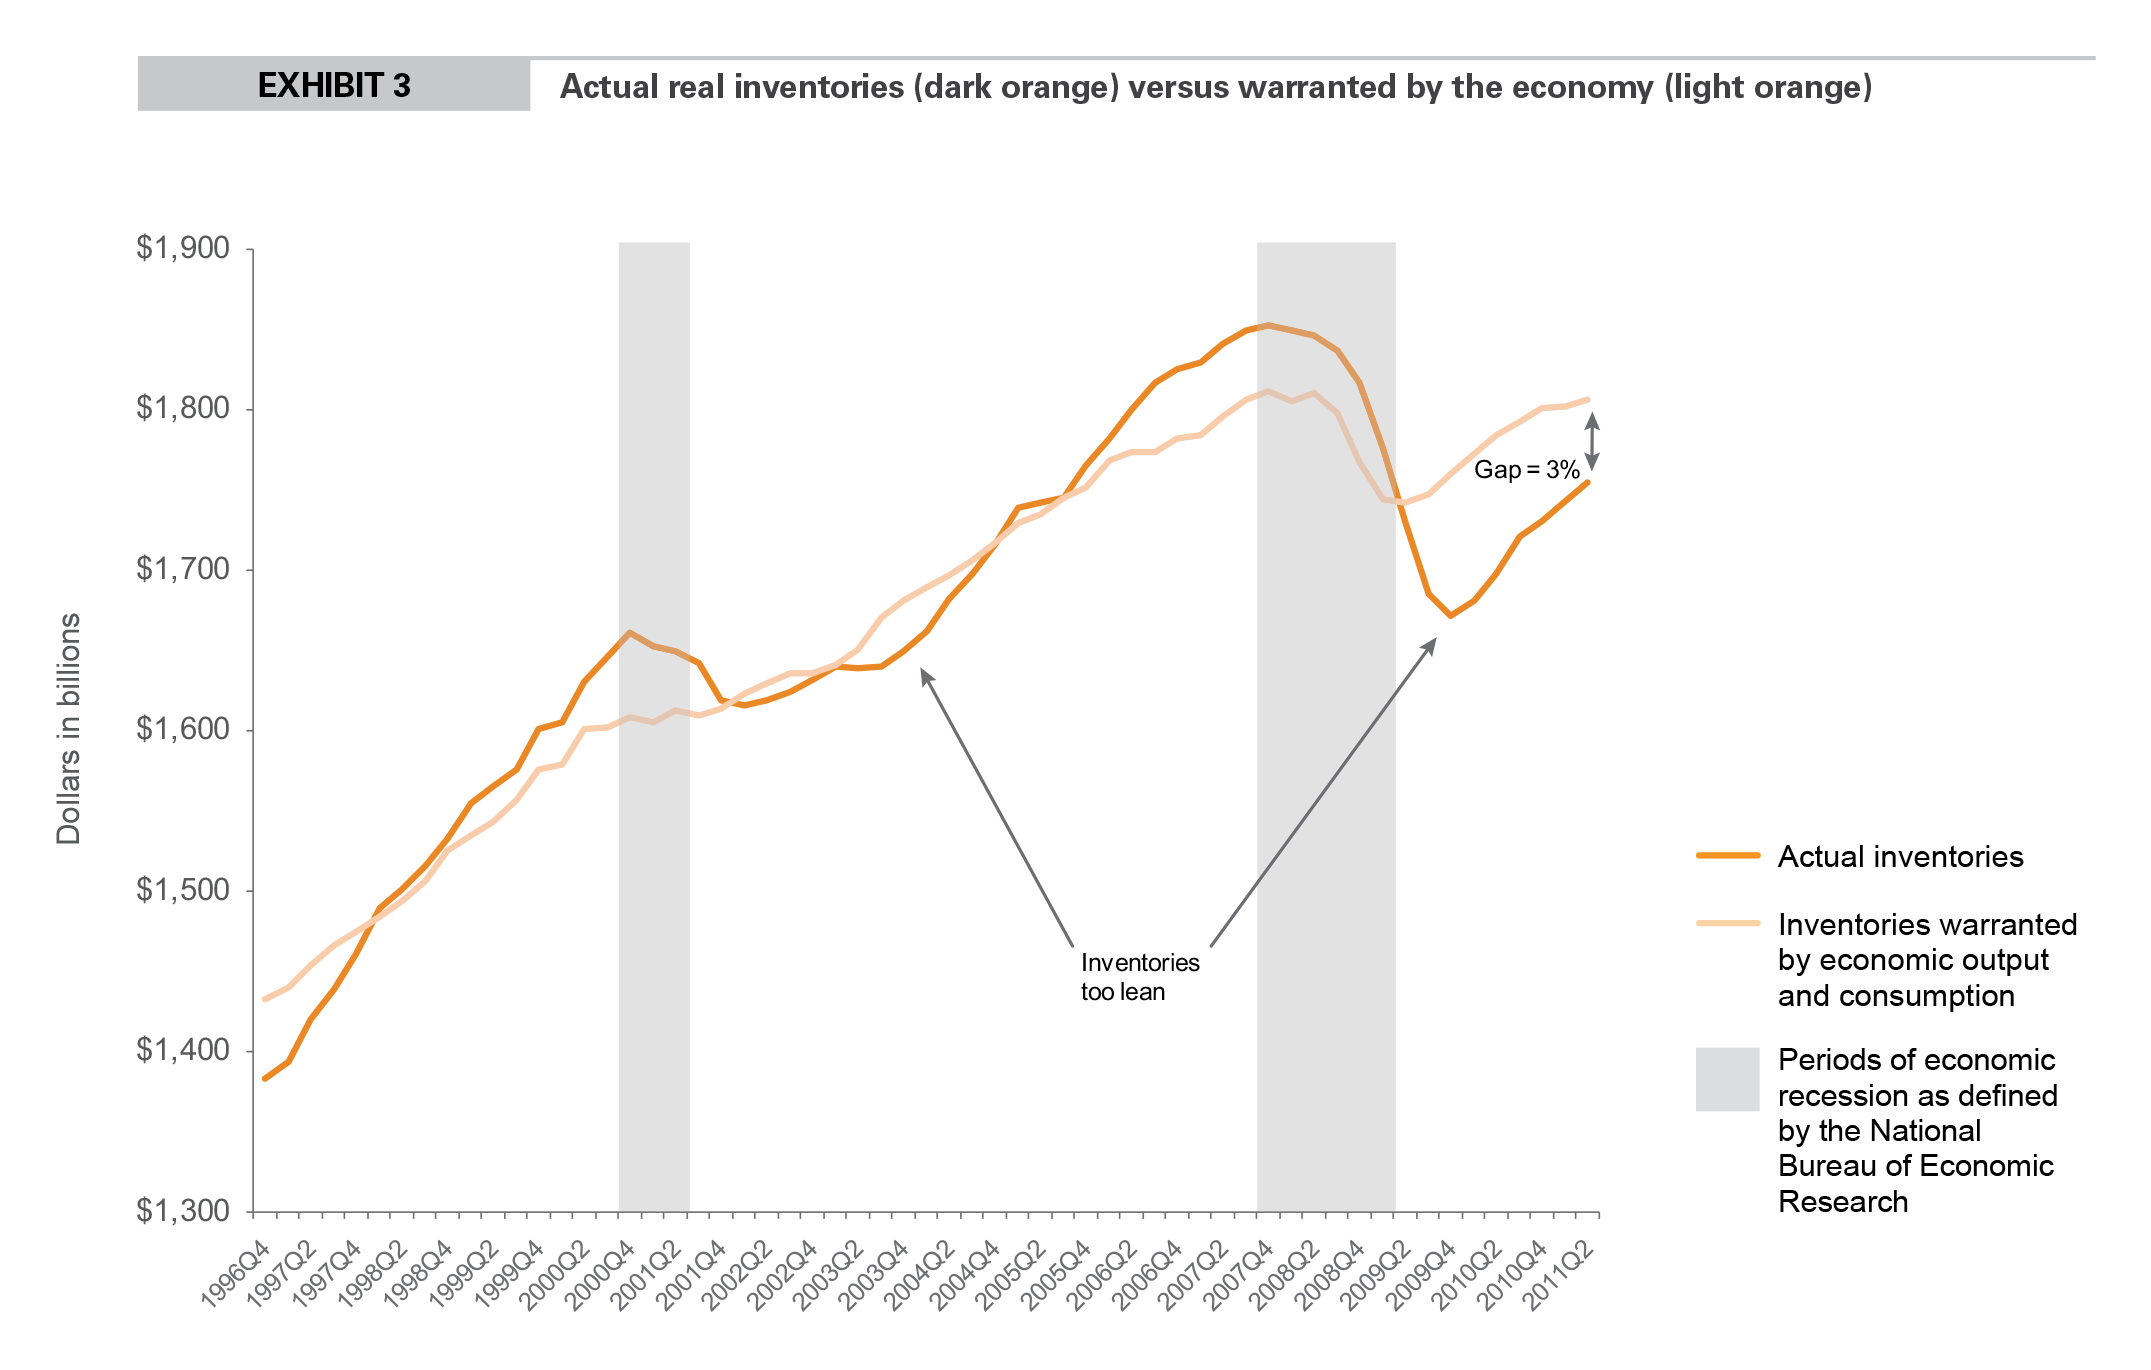
Following a recession, inventories over-correct before rebounding. While inventories have been recovering, they need to regain about 3% to close the gap warranted by current levels of economic output and consumption. Since we expect moderate economic growth in the second half of 2011 and stronger annual growth in 2012, the gap in stocks is growing.
Corporate profits are at record levels
Our proprietary Industrial Business Indicator (IBI) jumped to 58.9 in June, above April and May levels. The index slipped to 54.1 in July and then 53.1 in August, reflecting the recent global volatility. However, the index is not seasonally adjusted and is still indicative of a U.S. economy that is expanding well above the 1.3% annual rate registered in the second quarter. This view is supported by the August ISM survey of large manufacturers that is consistent with U.S. economic growth of 2.8% on an annualized basis. In August, the inventory component of the ISM reached 52.3, well above the level of 42.7 that is considered expansionary for inventories1.
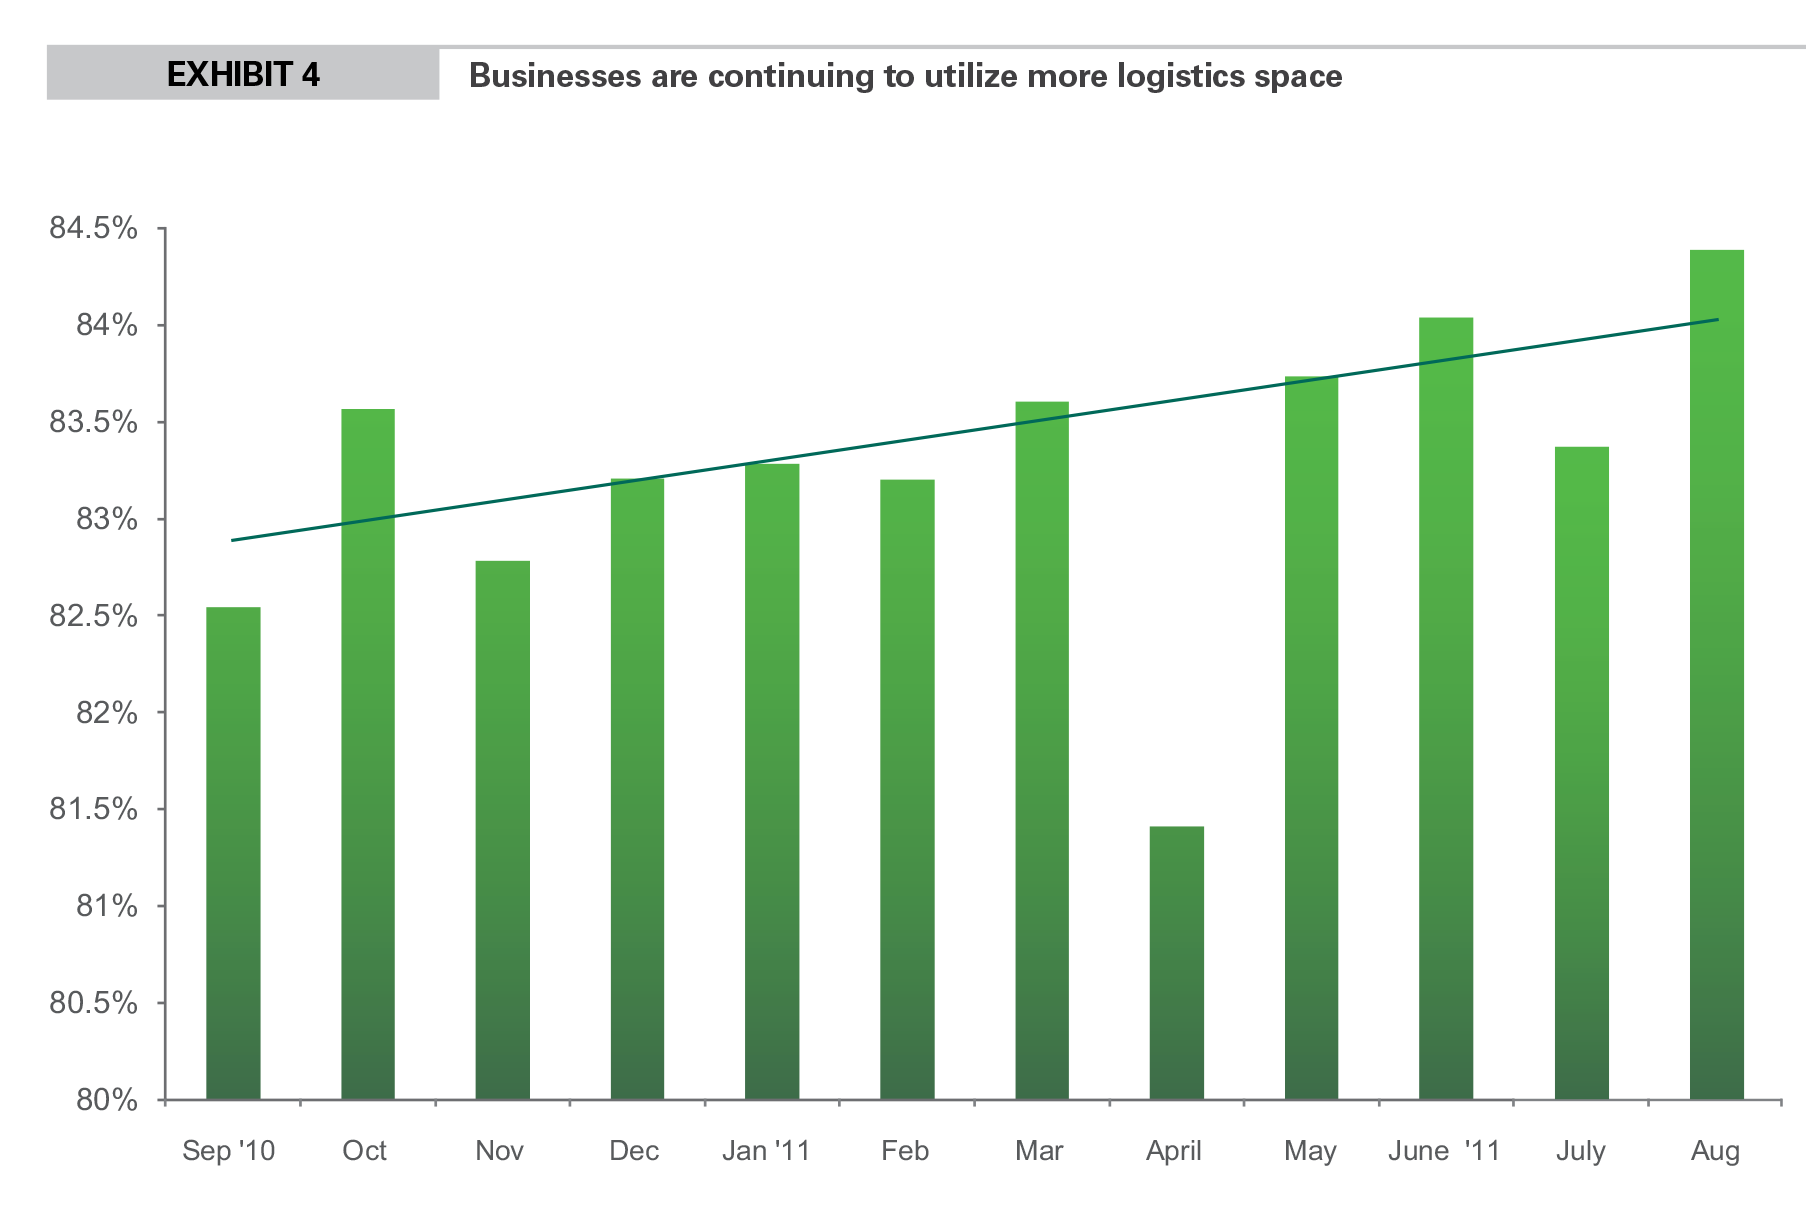
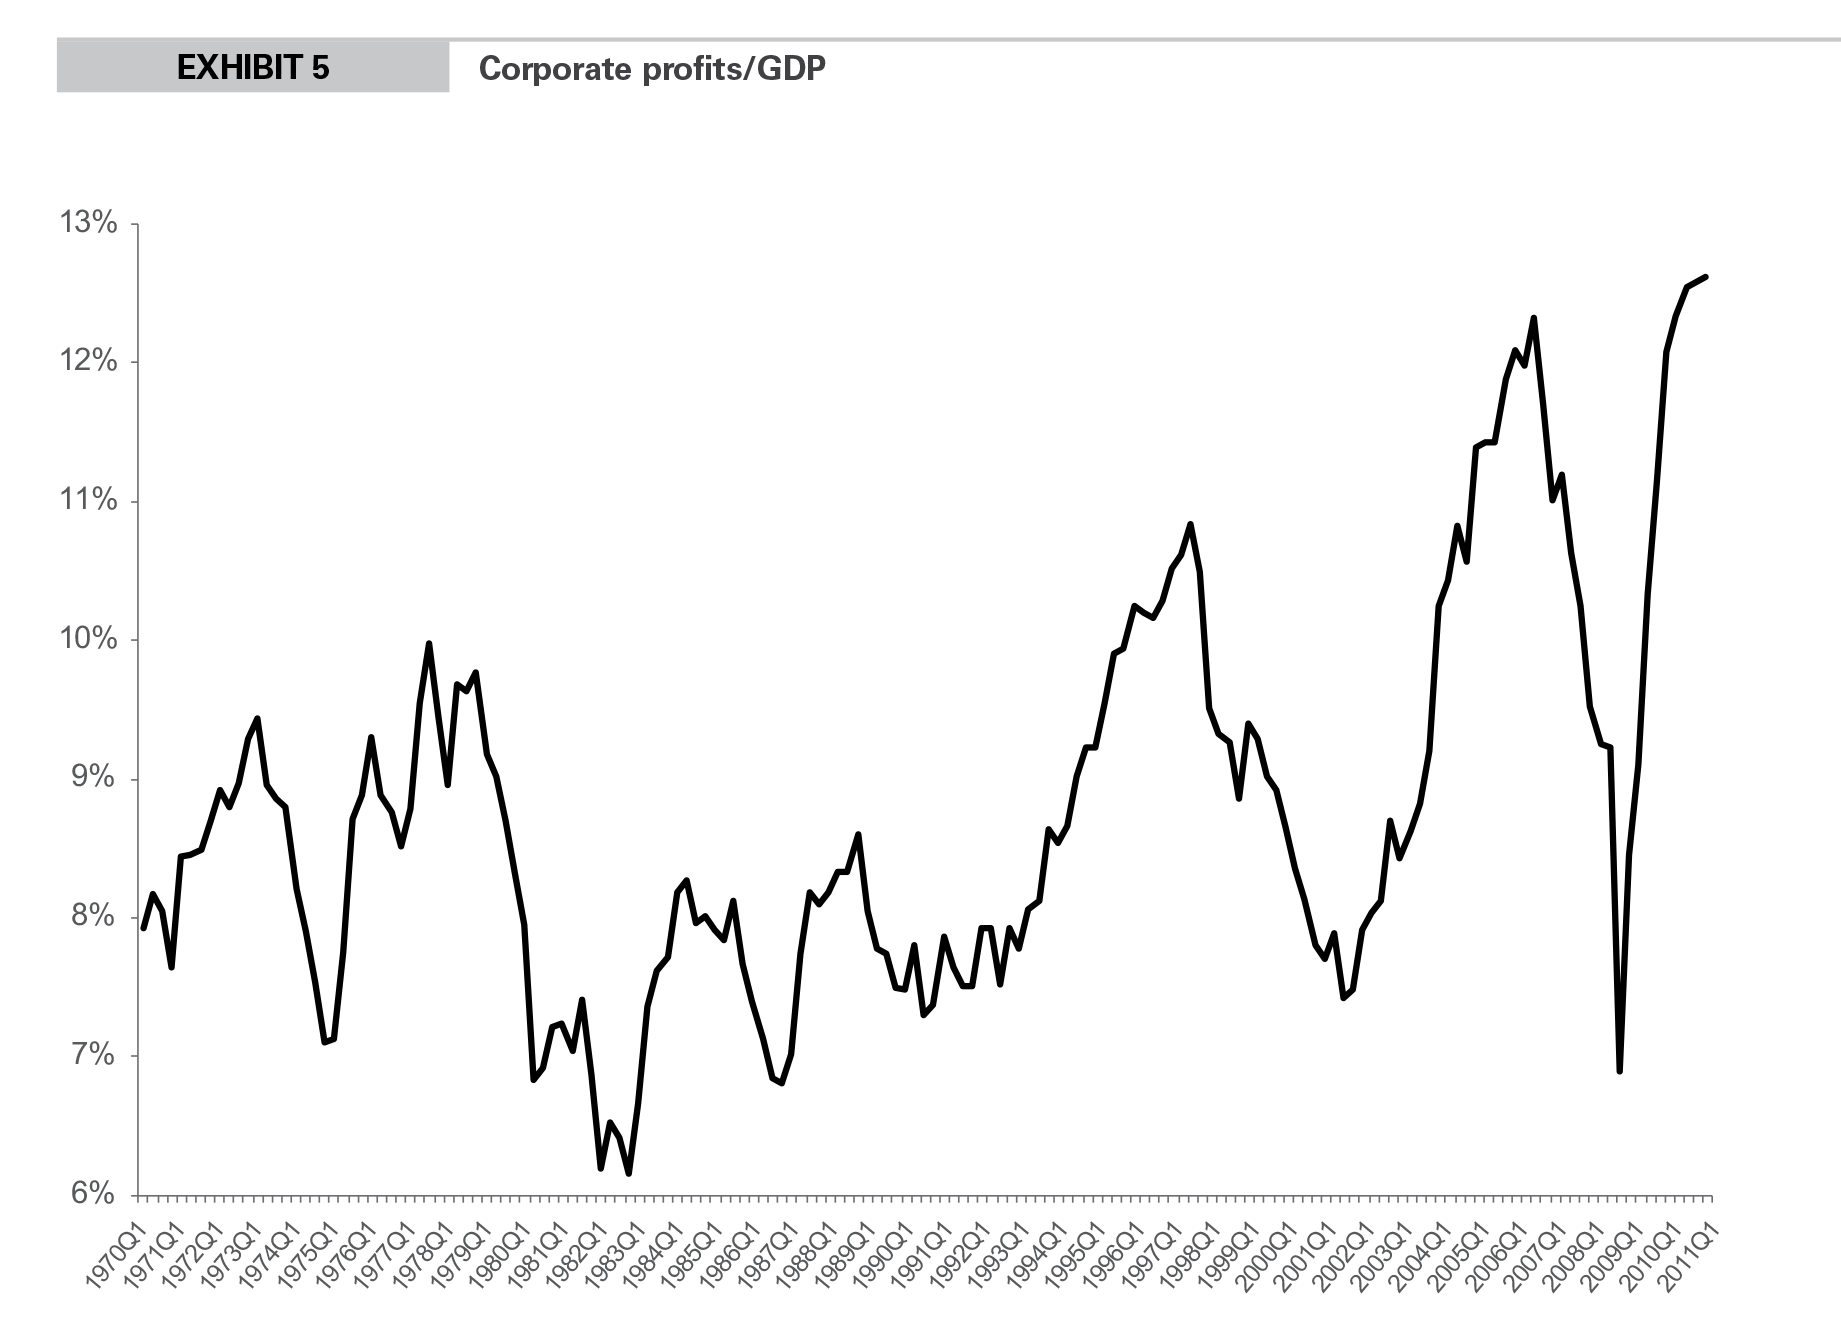
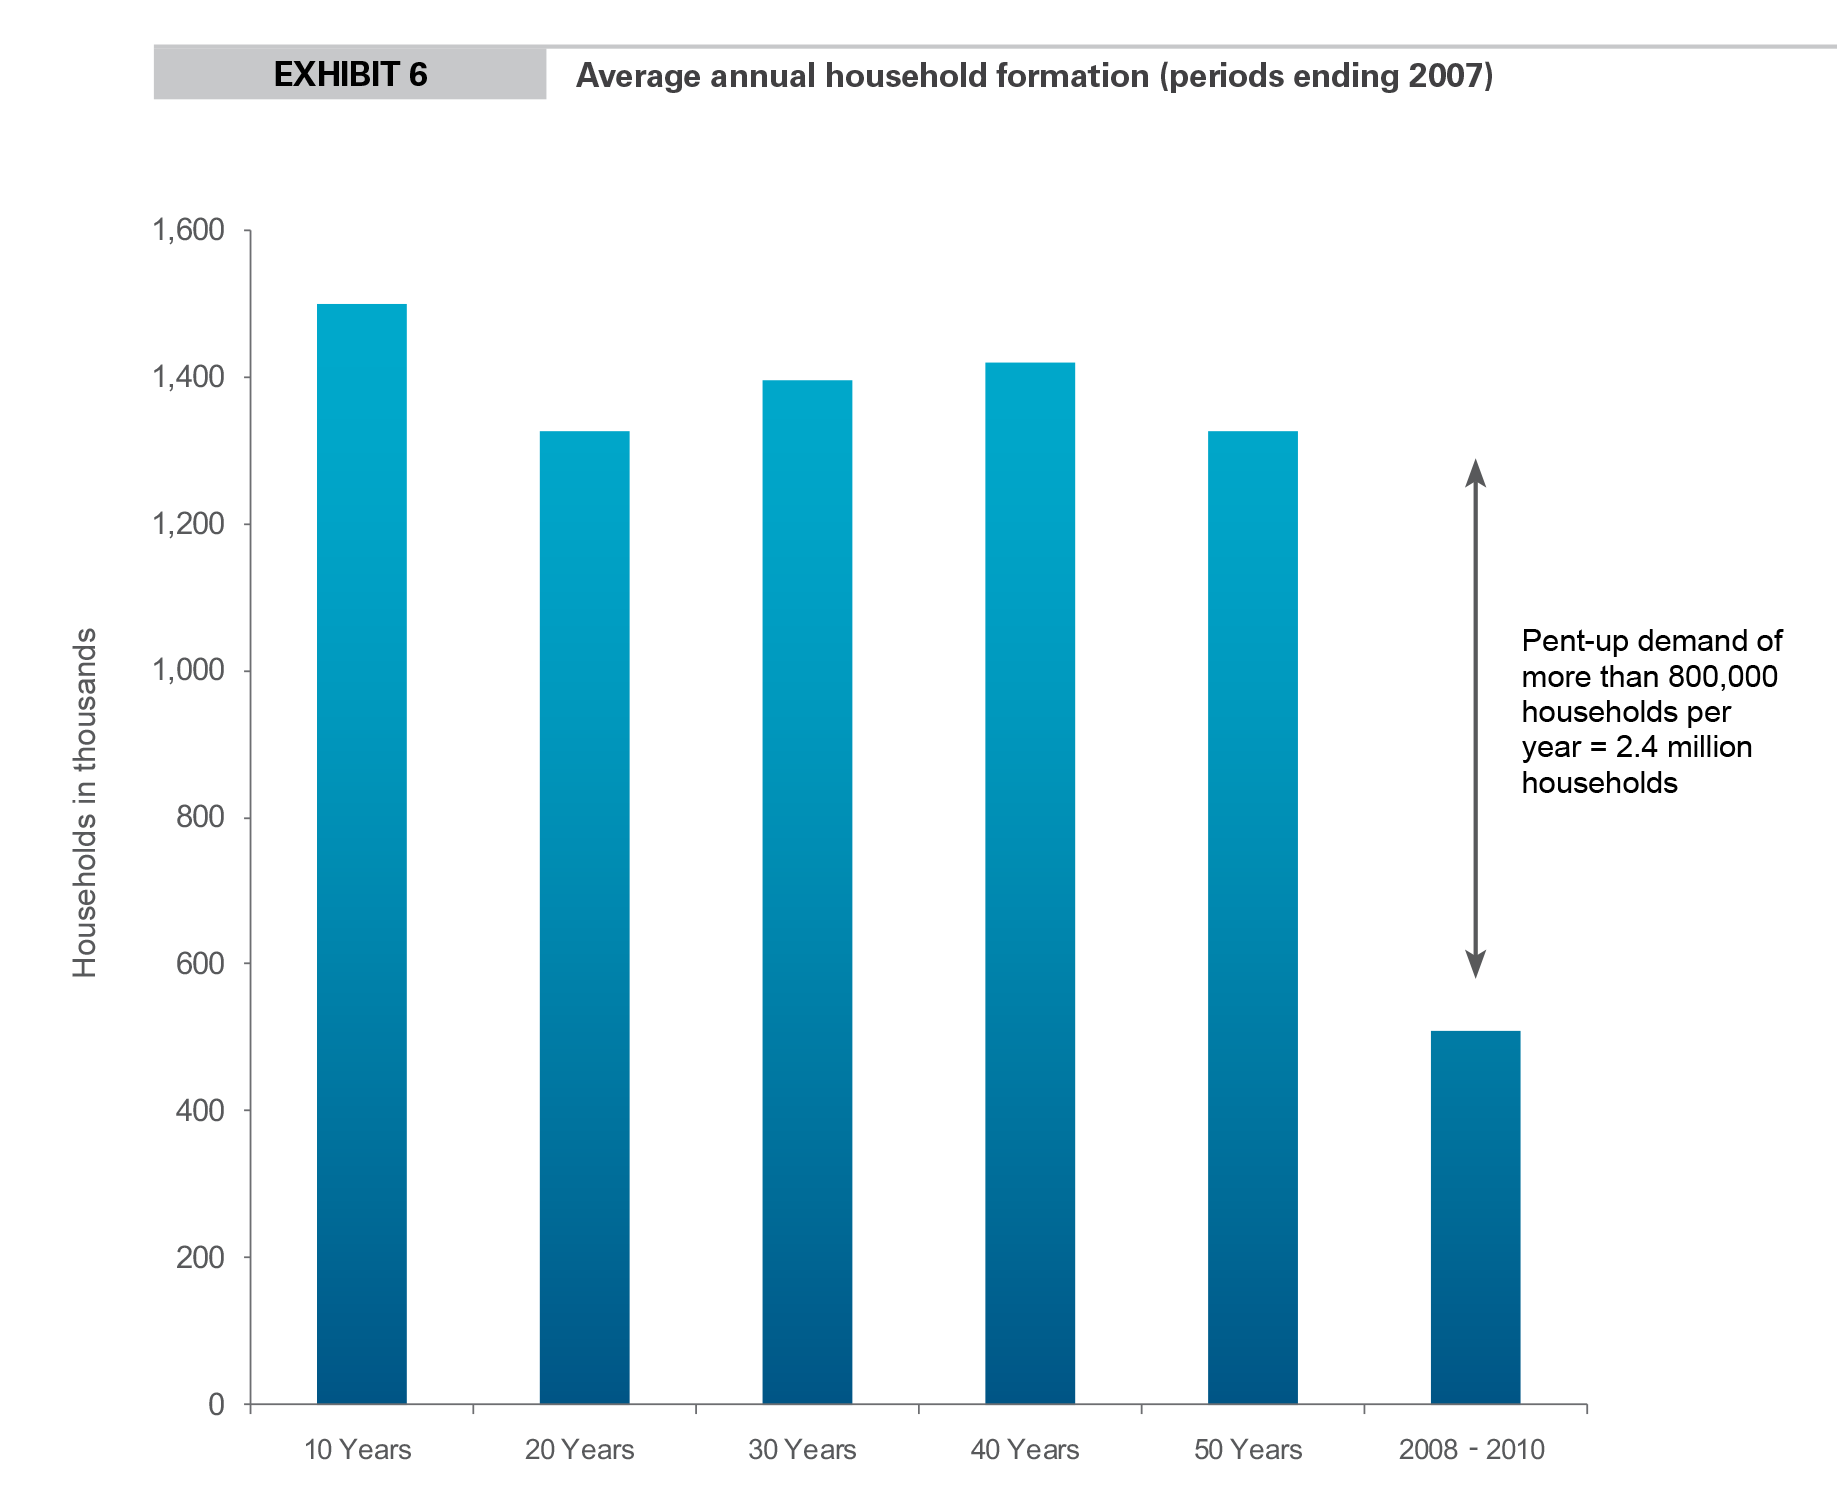
For the purposes of the IBI, we survey our customers monthly to discuss the amount of logistics space they are currently using compared to what would be considered optimal under normal business conditions. The utilization rate has been trending upward since we began collecting this data in September 2010, with the exception of a dip in April 2011 (likely caused by global supply chain disruptions related to Japan). Exhibit 4 illustrates that space utilization rates rebounded in May and in fact reached a record high in August as inventory rebuilding continued. While global shocks and dismal economic headlines have increased volatility and downside risk, we believe that the stalled labor markets in the United States will begin to mend from their soft spot in August. U.S. corporations today are earning record profit levels relative to overall GDP (Exhibit 5) and are sitting on record levels of cash. Typical economic recoveries are characterized by early periods of high productivity (output per hour worked) as employment falls faster than GDP and fewer workers are left to produce. However, productivity fades as the recovery progresses and limited additional output can be squeezed out of each remaining worker. This cycle is no different as productivity has fallen from a 6.5% annual rate in the third quarter of 2009 to less than zero in the first two quarters of 2011. If productivity remains near its current levels, an additional 2% of GDP growth would translate to approximately 2.6 million jobs. Not only would this spur direct consumption, but it would also kick-start the pent-up demand in household formation. During the downturn, households were very slow to form, as jobs were scarce and savings rates rose. Historically, the United States has added 1.2 to 1.3 million households per year; however, this number has fallen to closer to 500,000 per year during the crisis and recovery (Exhibit 6). Therefore, as jobs continue to be added, this pent-up demand will turn into actual new household formation, which in turn should fuel a recovery to a more normalized housing market, spurring even more jobs and consumption. However, if jobs are not added and productivity continues to contract another recession would be likely.
Our original forecast for global net absorption in 2011 was 165 million square feet. However, we have tempered our forecast because of recent global economic and financial volatility, political gridlock and slower than expected growth in the first half of the year. We now expect between 125 and 165 million square feet of net absorption in 2011, with some of the previously expected growth pushed out an additional quarter or two. We expect net absorption as a percent of stock to surpass its pre-crisis peak level in 2012, though availability will be higher than it was at peak due to the delivery of new product in the early part of the downturn.
Conclusion: Broadening global recovery to boost demand for logistics space
Consensus forecasts indicate that record levels of real GDP will be realized in most of the major economies in 2011. Two years into the global economic recovery, trade is already well past its prior peak. While second half economic growth will be slower than originally anticipated, we expect employment to gain traction and household formation to drive new demand into 2012. These factors, paired with continued increases in consumption as well as rising and unsustainably low inventory levels, will drive significant increases in net absorption. In fact, based on the consensus outlook for GDP growth, production and trade, our models indicate that the world should see nearly 400 million square feet (more than 1% of stock) of net absorption in 2012. Therefore, on a global basis, we expect continued demand for logistics real estate in the short- and medium-term.
Footnotes
- Institute for Supply Management, August 2011 Manufacturing Report on Business, http://www.ism.ws/ISMReport/MfgROB.cfm
About the Author
David C. Twist is Vice President, Research, for Prologis, responsible for the company’s global research initiatives. He has been in real-estate-related research since 1990. Twist is a member of the National Association of Industrial & Office Properties (NAIOP) and the CFA Institute. He received a bachelor’s degree in quantitative economics from the University of California, San Diego.
About Prologis
Prologis aspires to be the leading global real estate company with a vision of enduring excellence, while creating more opportunities and value for our fund investors. As of June 30, 2011, Prologis owned or had investments in properties and development projects expected to total approximately 600 million square feet (55.7 million square meters) in 22 countries on four continents, with a platform in regions that represent nearly 80% of global GDP. Prologis leases modern distribution facilities to more than 4,500 customers and strives to maintain the industry-leading global customer mix, using its expanded footprint to respond to evolving customer needs.
