
Prologis’ Industrial Business Indicator™ (IBI), the company’s proprietary survey of customer activity and facility utilization, reveals healthy momentum in the logistics market. Our customers reported record levels of activity in October, accelerating into the fourth quarter after a strong summer. We anticipate net absorption of 215-220 MSF and 110 MSF of completions in 2014, with another year of positive excess demand in 2015 as demand again outpaces rising supply. This favorable supply/demand imbalance is expected to push vacancies to multi-cycle lows in more markets.
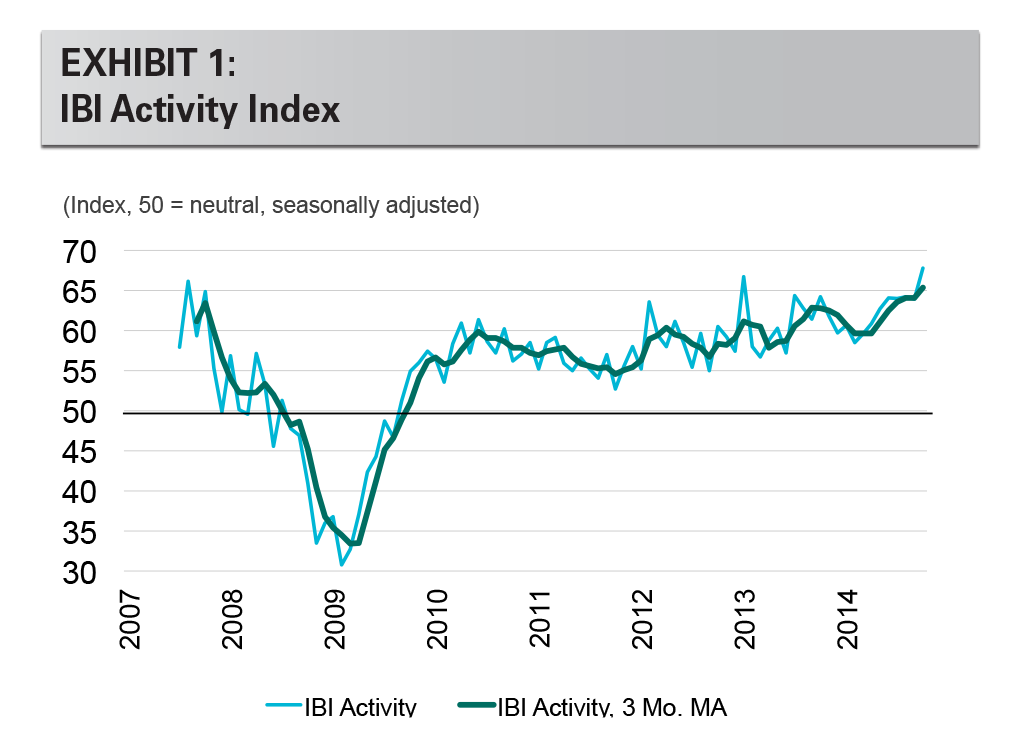
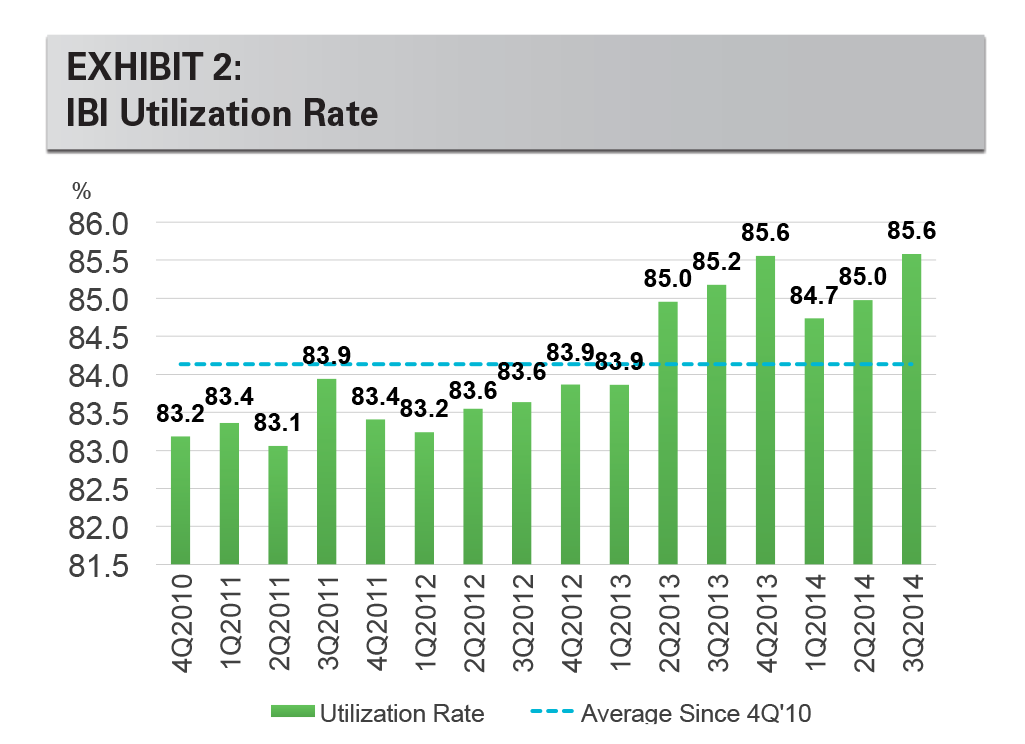
IBI results reveal that our customers achieved record levels of activity and utilization. The activity index surged to 67.8 in October after adjusting for seasonality, the highest since the survey began in 2007. The IBI is a diffusion index; results above 50 indicate expansion. This result continues the trend of improvement that emerged over the past two years. Activity index results were stable at a high level through the third quarter, with four consecutive months near 64 and then breaking higher in October. Further, the utilization rate component of our survey reached a new high in October. This combination of record business growth and low vacancy suggests business expansion will require increased demand for logistics space.
Our IBI shows that customers in all U.S. regions are expanding. August-October activity index results were above 50 in all U.S. regions, led by notable strength in the East Region. In addition, we see a theme of outperformance among infill markets and markets with a high concentration of small-space users such as San Francisco and New York/New Jersey. The Texas markets, including Houston and Dallas, also continue to outpace the national average. As supply in these markets expands, monitoring leading indicators of demand such as the IBI becomes even more important to gauge the ability of demand to keep pace. Several markets are enjoying expansion, though at a slower rate than average. These markets include Los Angeles and Seattle, where results are above 50 but have dipped below the national average, suggesting the dissipation of a recovery spike into a more sustainable expansion. Index laggards are smaller regional markets that are earlier in the recovery cycle.
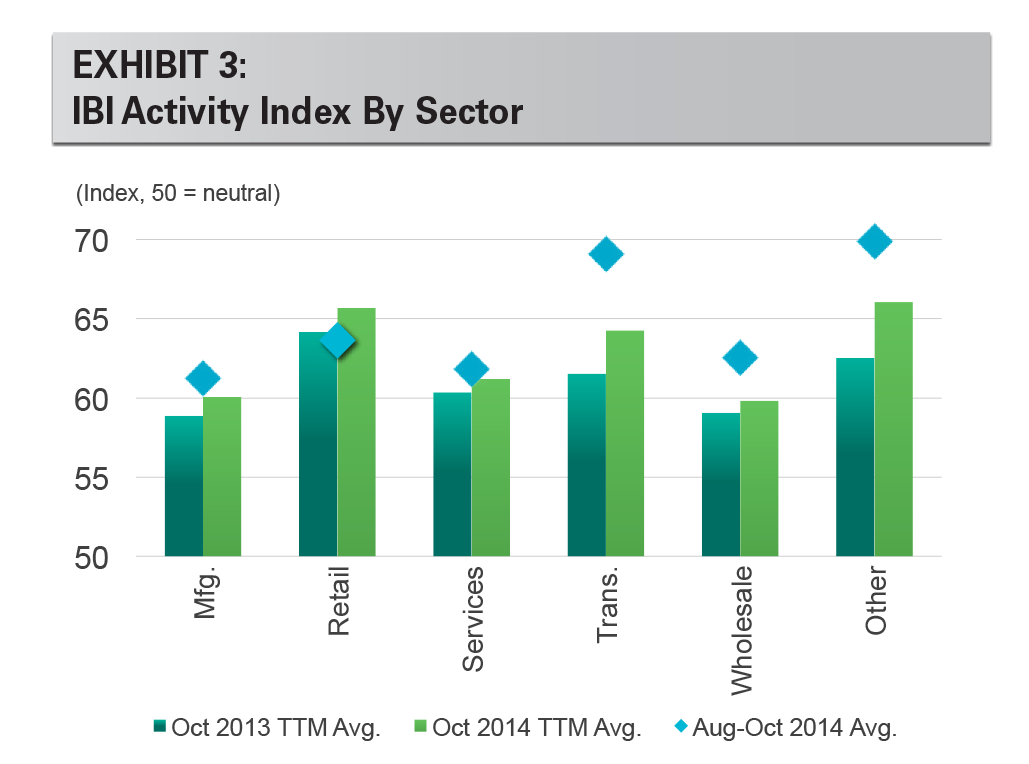
Record IBI results continue to be broad-based among customer industries. All six industry verticals tracked by the IBI were above 60 in the past three months. Customers in transportation again reported the strongest activity gains. This category includes third-party logistics providers, a large segment that in turn represents clients across a variety of industries. The health of the transportation sector, and third-party logistics providers in particular, is a positive sign for the diversified growth of logistics.
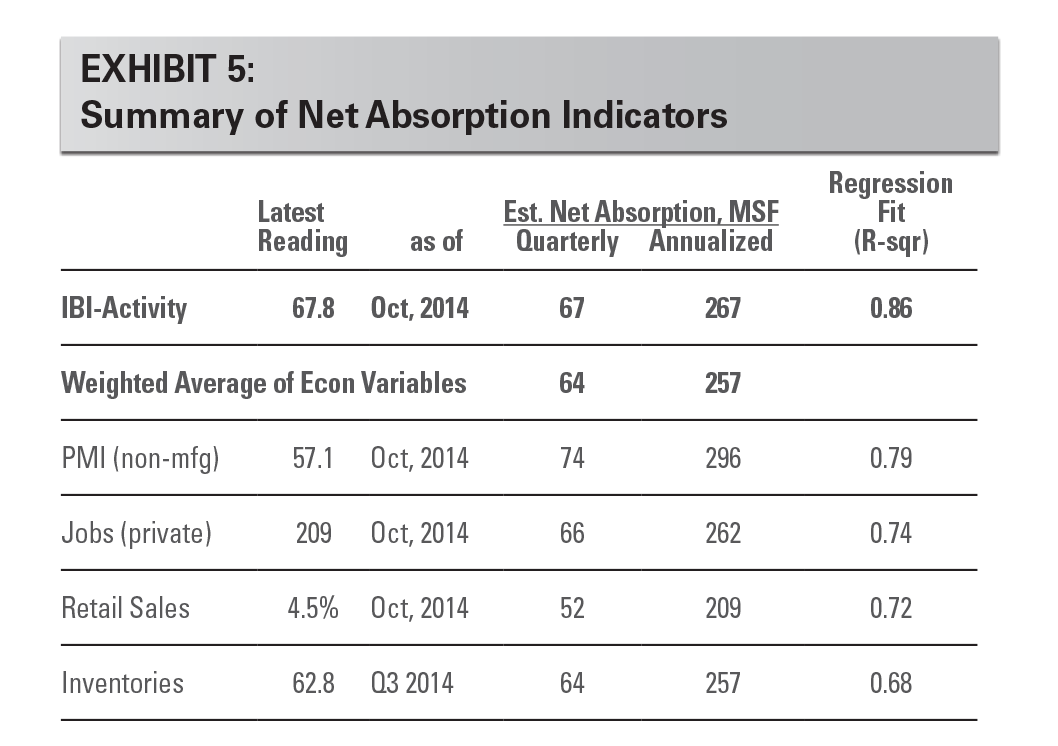
The strong U.S. economy is a boost to the logistics market expansion. Following volatile growth in the first half of the year, economic data improved meaningfully in the third quarter. Additional indicators are regaining pre-recession levels. Exhibit 5 highlights leading indicators and implied net absorption based on our regression analyses. The ISM non-manufacturing PMI, a key leading indicator for logistics, averaged 59.0 in the third quarter, the highest since 2004. Job growth has averaged 229,000 per month in 2014, lifting consumer confidence and boding well for the upcoming holiday retail sales season. This trend is important, as retail sales have underperformed thus far during the recovery. One risk to the outlook is that economic growth outside the U.S. has been less uniform and robust.
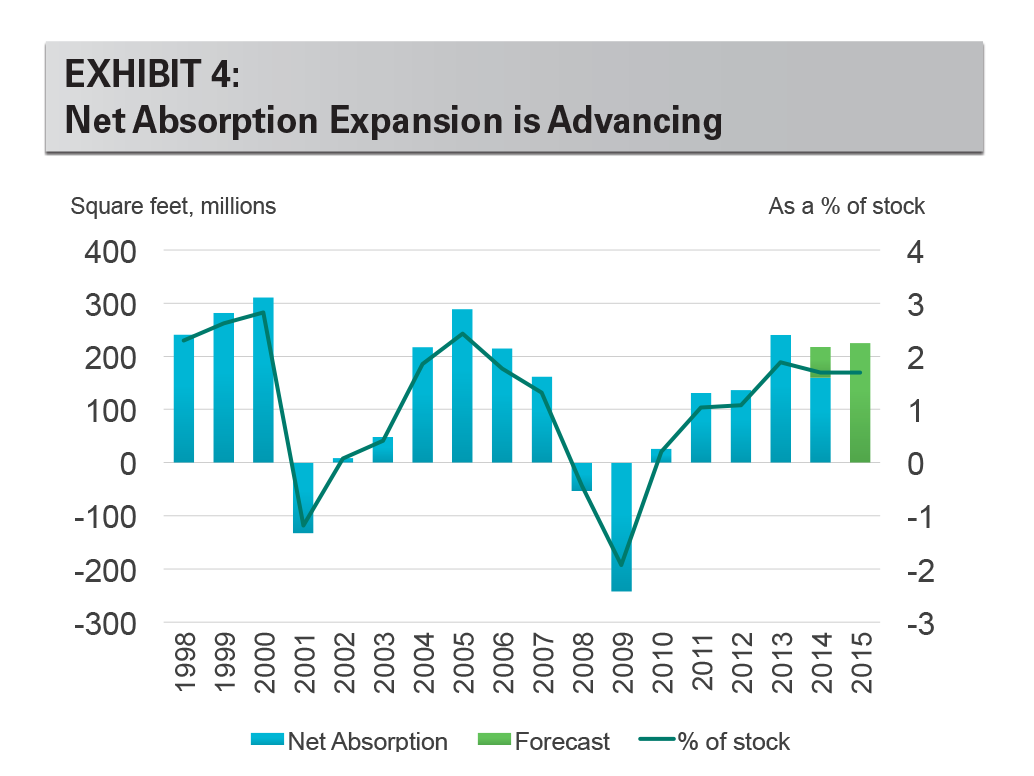
Supply in the logistics market is normalizing but demand is driving lower vacancy. According to data from CBRE Econometric Advisors, demand in the first three quarters of 2014 was 160 MSF (1.2 percent of stock), twice the amount of supply at 82 MSF (0.6 percent). This favorable supply/demand imbalance is pushing vacancies lower in most markets, with many at multi-decade or even all-time lows. CBRE-EA estimates that new supply underway is 127 MSF, with a healthy mix of speculative and build-to-suit projects. In a few markets, including Indianapolis and Dallas, supply has closed the gap to demand, and we expect vacancies to rise. Changes in the supply pipeline in the third quarter include increases in Chicago and Atlanta, bringing these markets closer to balanced supply conditions. Southern California saw strong demand that improved the demand-supply pipeline ratio.
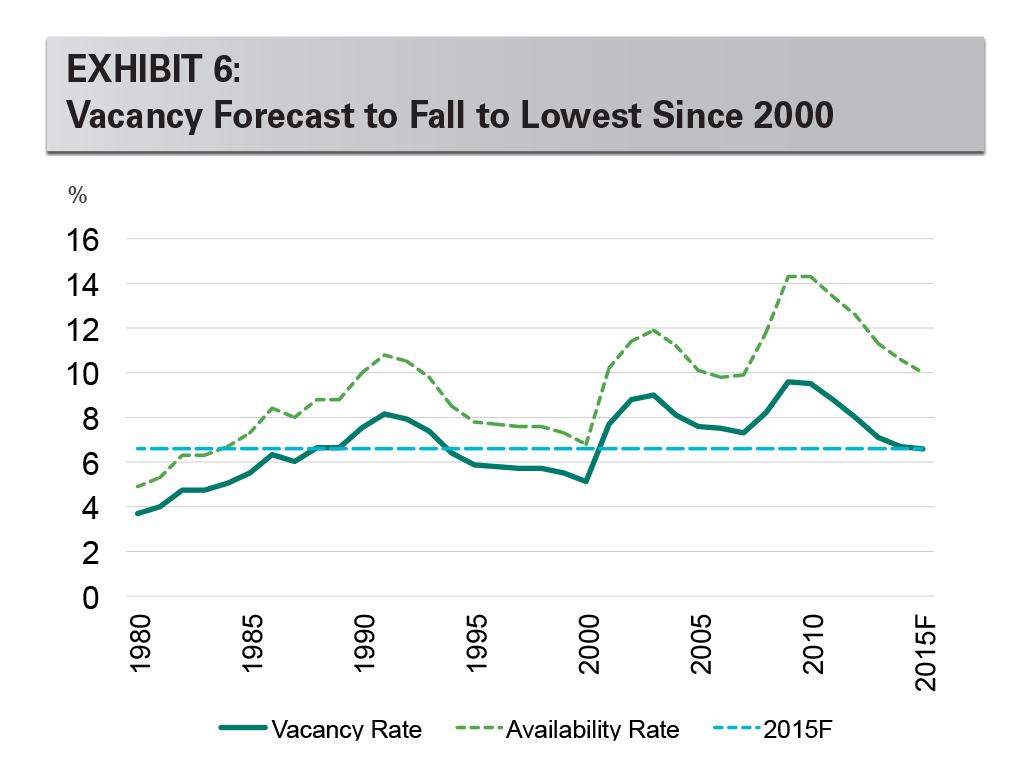
Prologis forecasts another year of positive excess demand in 2015, with vacancy falling to the lowest level since 2000. Tailwinds in the logistics market from the economy, improving business confidence and elevated utilization levels lead us to believe the national market will achieve another year of more than 200 MSF of net absorption. Given the current supply pipeline and growth of starts, we expect supply will increase to 175 MSF in 2015 after an anticipated 110 MSF in 2014. Improving market rent growth increasingly warrants more supply – although perhaps less than would have been expected two to three years ago now that rising construction costs are an offsetting factor.
CONCLUSION
Strong economic conditions support demand for logistics real estate in the U.S. Leading indicators of demand, including the Prologis IBI survey, continue to illustrate expansion. Supply is rising to meet growing demand, but many markets have limited availability and demand remains ahead of supply nationally. Logistics market fundamentals are poised for another year of healthy performance as strong momentum carries into 2015.
Forward-Looking Statements
This material should not be construed as an offer to sell or the solicitation of an offer to buy any security. We are not soliciting any action based on this material. It is for the general information of customers of Prologis.
This report is based, in part, on public information that we consider reliable, but we do not represent that it is accurate or complete, and it should not be relied on as such. No representation is given with respect to the accuracy or completeness of the information herein. Opinions expressed are our current opinions as of the date appearing on this report only. Prologis disclaims any and all liability relating to this report, including, without limitation, any express or implied representations or warranties for statements or errors contained in, or omissions from, this report.
Any estimates, projections or predictions given in this report are intended to be forward-looking statements. Although we believe that the expectations in such forward-looking statements are reasonable, we can give no assurance that any forward-looking statements will prove to be correct. Such estimates are subject to actual known and unknown risks, uncertainties and other factors that could cause actual results to differ materially from those projected. These forward-looking statements speak only as of the date of this report. We expressly disclaim any obligation or undertaking to update or revise any forward-looking statement contained herein to reflect any change in our expectations or any change in circumstances upon which such statement is based.
No part of this material may be copied, photocopied, or duplicated in any form by any means or redistributed without the prior written consent of Prologis.
Prologis Research
Prologis’ research department studies fundamental and investment trends and Prologis’ customers’ needs to assist in identifying opportunities and avoiding risk across four continents. The team contributes to investment decisions and long-term strategic initiatives, in addition to publishing white papers and other research reports. Prologis publishes research on the market dynamics impacting Prologis’ customers’ businesses, including global supply chain issues and developments in the logistics and real estate industries. Prologis’ dedicated research team works collaboratively with all company departments to help guide Prologis’ market entry, expansion, acquisition and development strategies.
About Prologis
Prologis, Inc., is the leading owner, operator and developer of industrial real estate, focused on global and regional markets across the Americas, Europe and Asia. As of September 30, 2014, Prologis owned or had investments in, on a consolidated basis or through unconsolidated joint ventures, properties and development projects totaling approximately 585 million square feet (54.3 million square meters) in 21 countries. The company leases modern distribution facilities to more than 4,700 customers, including manufacturers, retailers, transportation companies, third-party logistics providers and other enterprises.
Copyright © 2014 Prologis, Inc. All rights reserved.


