OVERVIEW
Industrial real estate supports one of the most vital components of the global economy today – logistics. The continuing ascent of global trade, the growing middle class in emerging markets and the ongoing reconfiguration of the global supply chain have all affected the industrial real estate sector in a positive way.
On a pan-European basis, industrial property values have only increased marginally following the global financial crisis. Yet, despite continued financial pressures in the region, Prologis research indicates the recovery of industrial values in Europe should continue at a stronger pace compared with the other real estate sectors. Cyclical factors, including a deficit in Class-A space and attractive supply-demand dynamics, as well as major structural trends such as the rise of e-commerce, make this an excellent time to invest in the European industrial logistics market.
Assembling a high-quality industrial portfolio – one that comprises efficiently managed, well-located modern properties – is more challenging than with other types of property portfolios. Factors such as small lot sizes, scarcity of land in key global markets, and multiple barriers to entry prevent most providers from gaining traction and establishing significant scale. As a result, investors’ options for choosing a viable partner are limited. For investors, this lack of choice often results in under-allocation to the sector. Although industrial is an under-allocated sector with a current weighting of approximately 7.4% in Europe, it is becoming increasingly attractive driven by high cash flows and income security.
The following key findings are indicated by our analysis:
- Europe’s industrial real estate values declined 21.9% on average from the pre-crisis peak (2007) to the trough (2009) of the market. Values are only up by 1.3% from the trough, providing considerable upside. Today’s values are attractive relative to replacement costs and the pattern of value recovery in the U.S. following the financial crisis.
- Despite weak GDP growth in the short term, trade and supply chain reconfiguration are expected to continue to drive strong demand for distribution space in Europe. This is in line with the historic trend. EU GDP growth was just 1.5% in last 10 years but the compounded average growth rate (CAGR) in take-up of distribution space equaled 13% over the same period. This underscores the fact that drivers of demand in logistics are rather structural (supply chain reconfiguration) than cyclical.
- The European logistics property market is relatively underdeveloped, particularly compared to the U.S. The U.S. market has more than four times the Class-A distribution stock relative to Europe. Europe is underserved and today has a small portion of Class-A logistics assets (approximately 14% of the industrial stock universe).
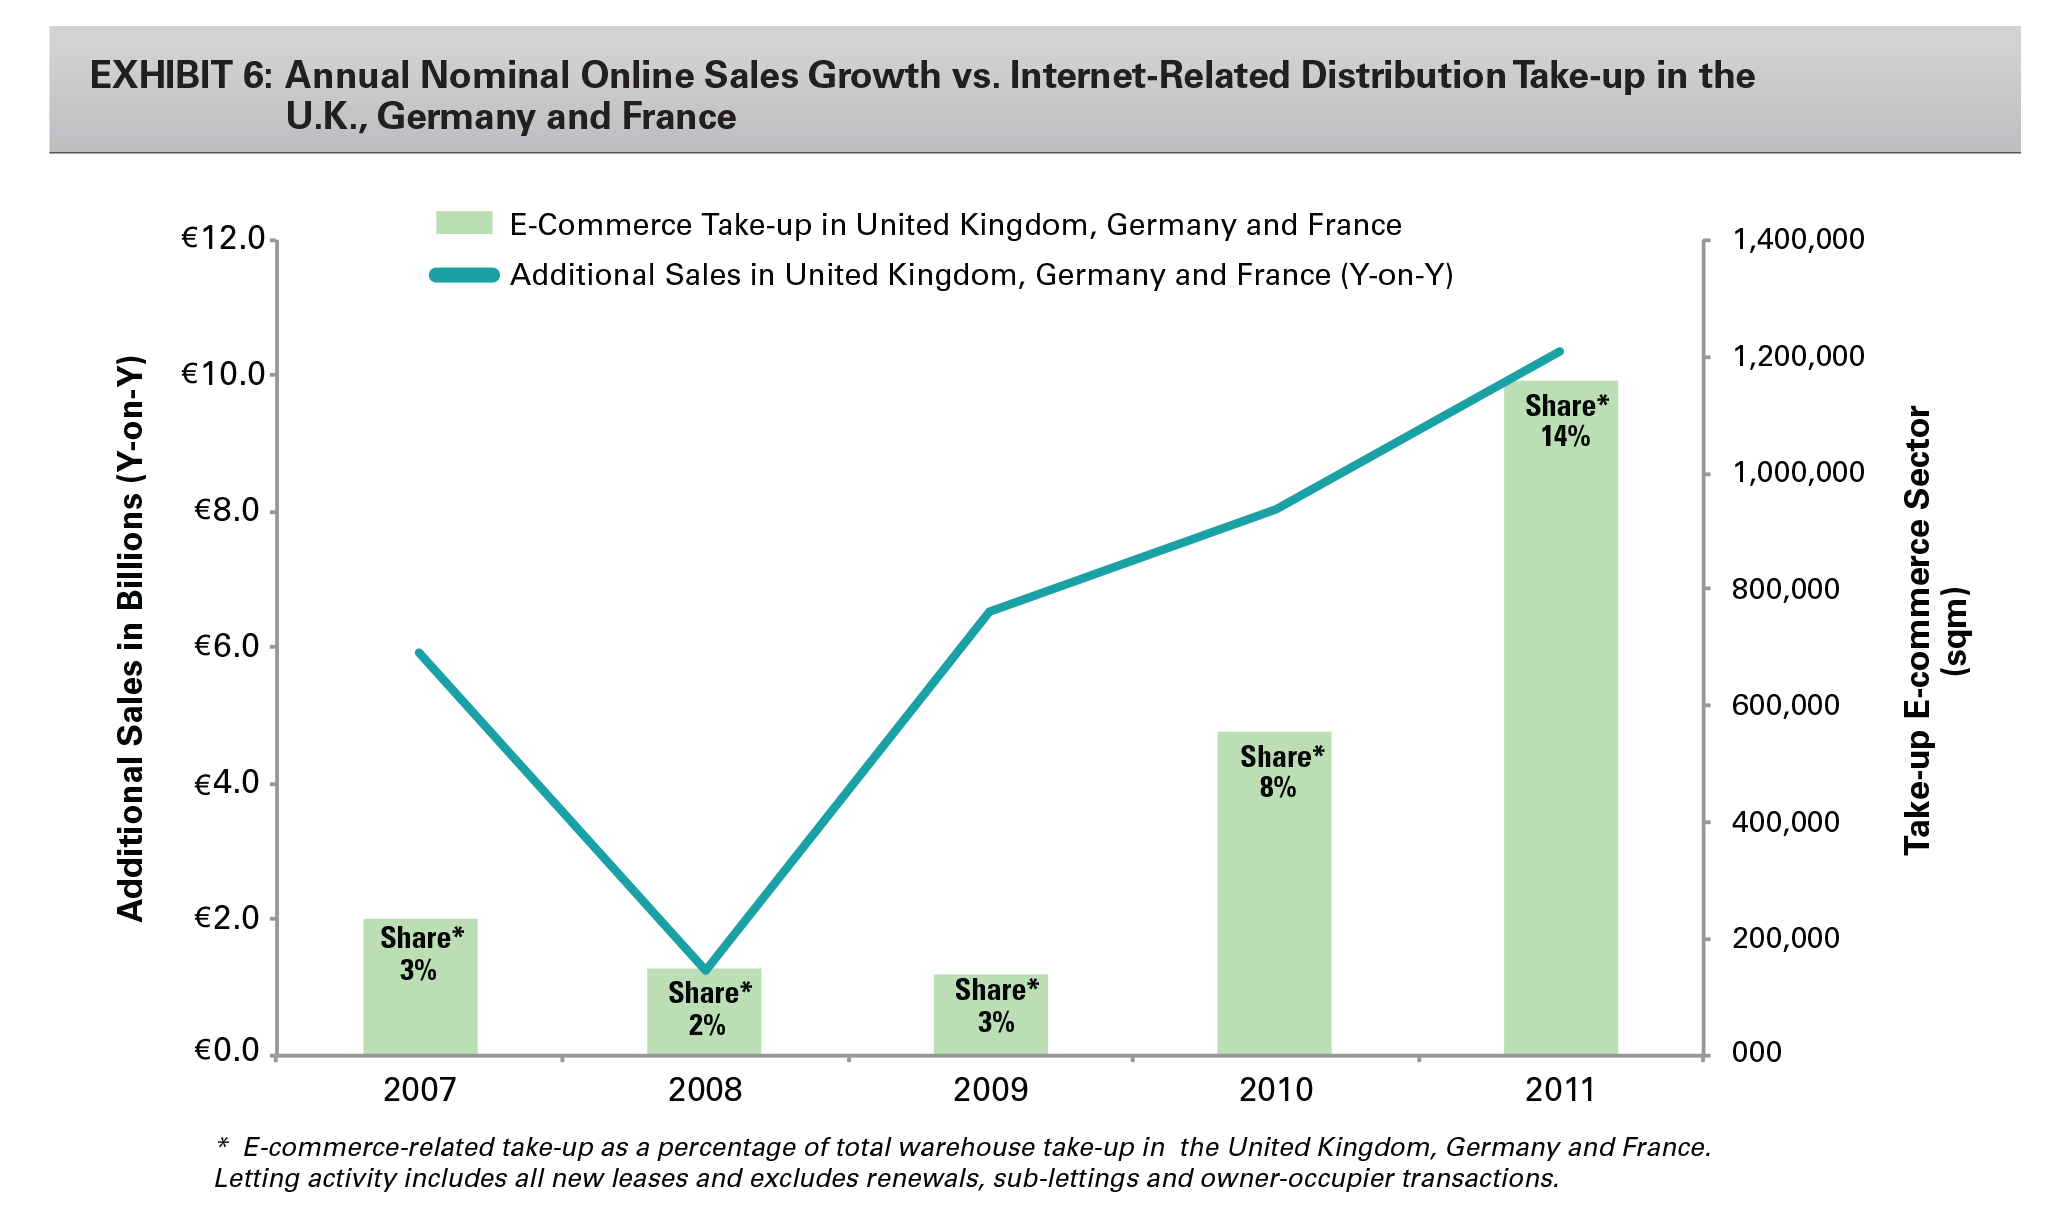
- E-commerce is increasing and requiring retailers to re-evaluate their distribution channels to support current demand and expected growth. Every additional €1 billion of online sales resulted in an average additional warehouse demand of approximately 72,000 square meters in the U.K., Germany and France over the last five years.
- Market fundamentals are improving and are at or beyond their inflection point. The availability of prime distribution facilities is expected to decrease over the next year, as existing supply and the amount of new, speculative developments continue to fall short of demand. Consequently, rents have bottomed and are well below peak and replacement cost rents. Furthermore, yields and industrial spreads over retail/offices and the risk-free rate are attractive from a historic perspective. As a result, these favorable conditions provide the impetus for the average capital and rental values to increase in the short to medium term.
WHY INDUSTRIAL IN EUROPE?
The industrial property sector has proven to be a solid and defensive asset class, providing an attractive risk/return profile with relatively low volatility or downside risk. Investments in industrial real estate have increased considerably, as this property class has gained favor with investors, leading to more transparency and liquidity. The investment volume in logistics increased from approximately €3.9 billion in 2001 to €16.3 billion in 20061. After a three-year period of anemic investment activity, investment volumes are back above historic averages again and totaled €9.9 billion in 2011, approximately 10% above the 10-year average.
High Total Returns
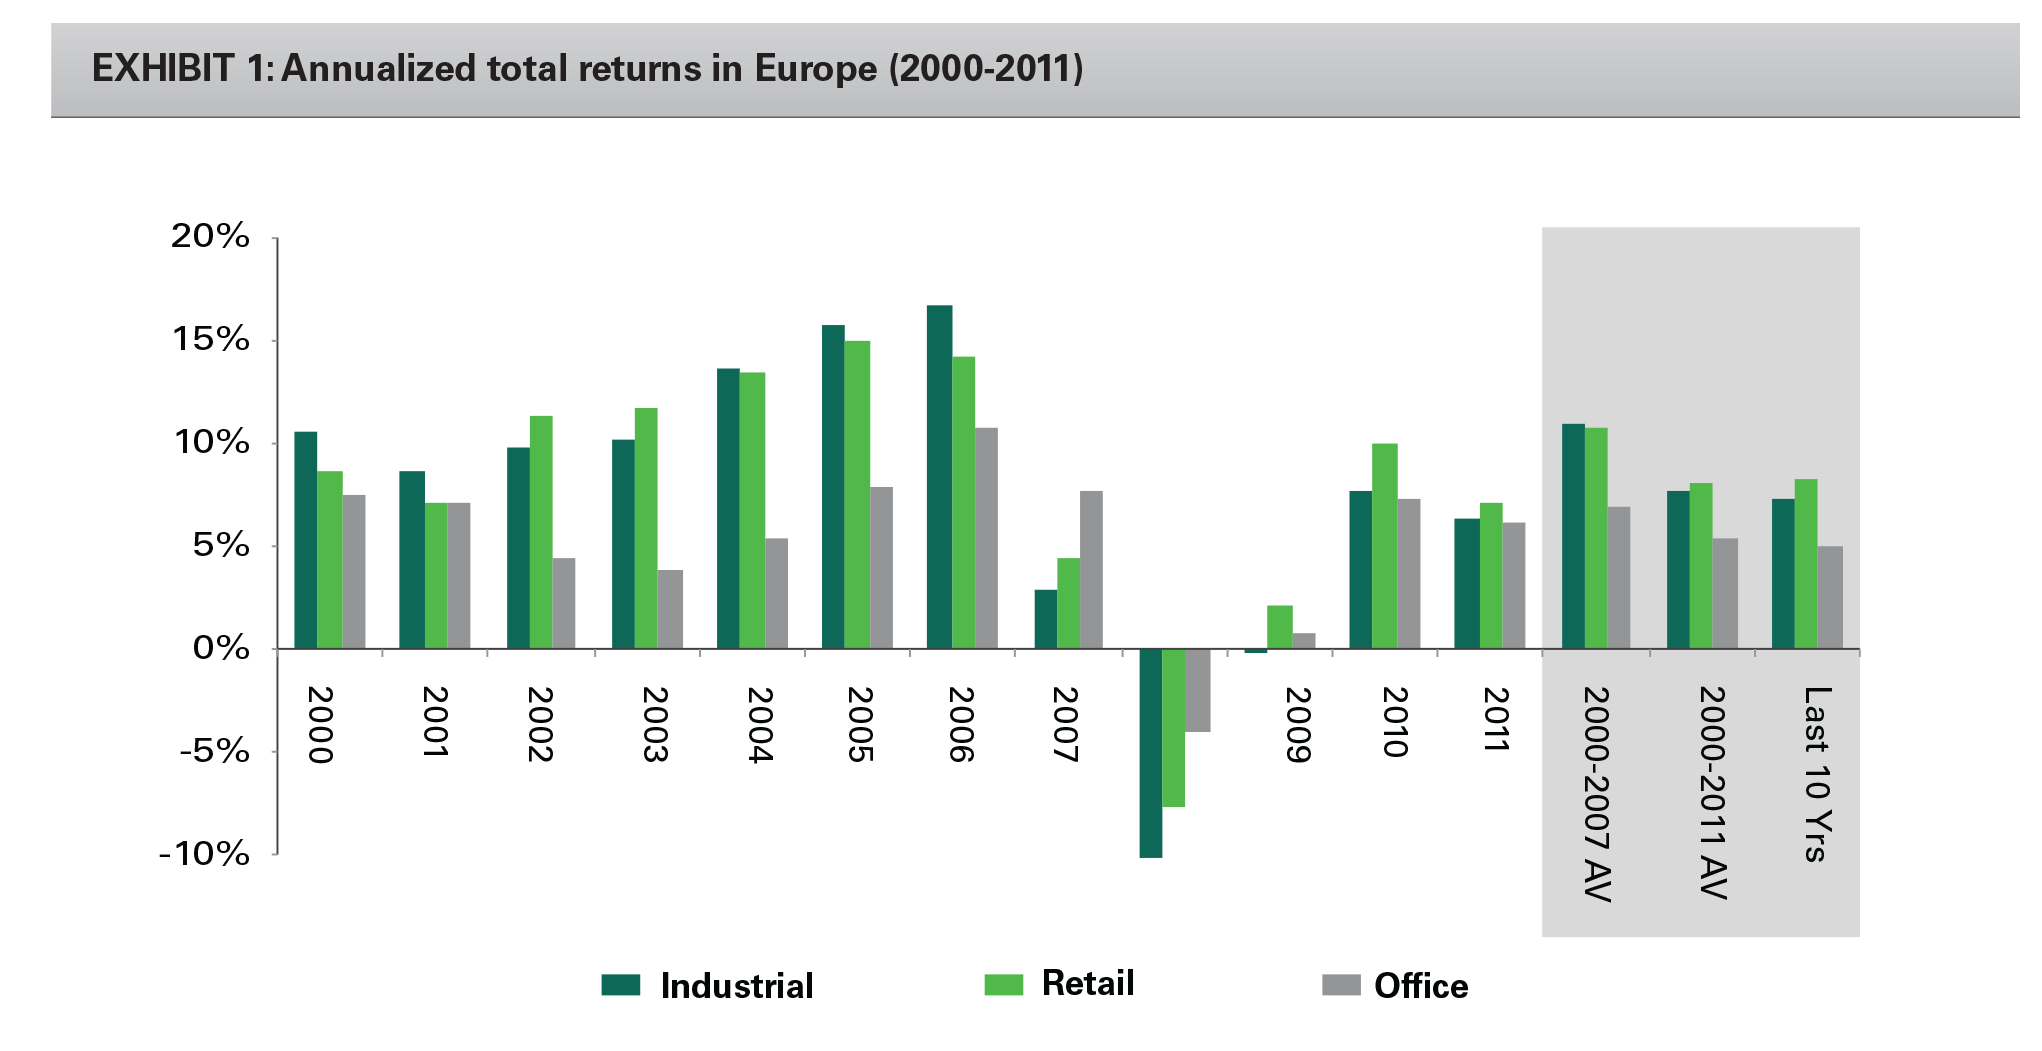
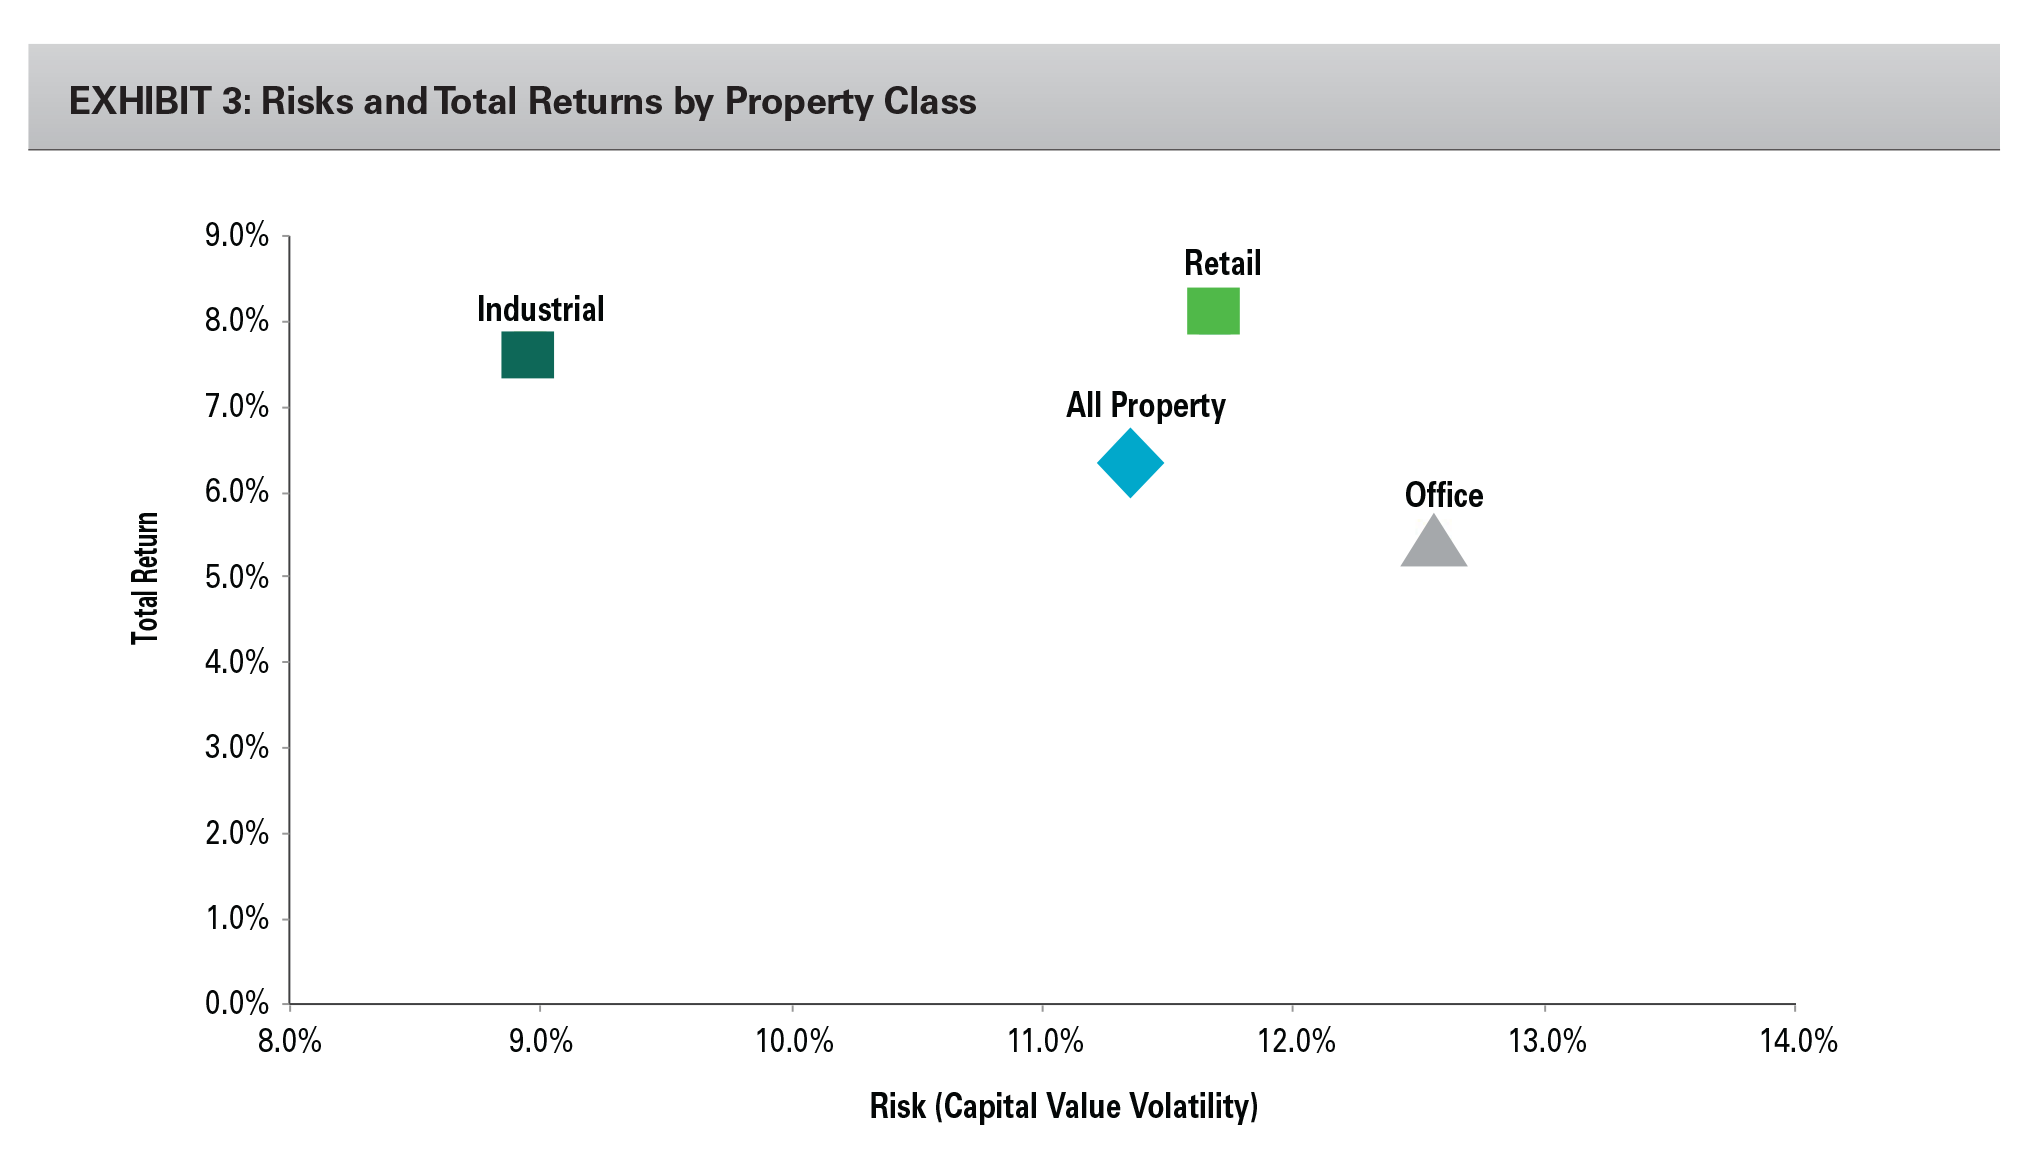
Despite muted economic growth, industrial has been the second-best-performing property sector, after retail, with an annualized return of 7.3% over the last 10 years. Since the start of the pan-European IPD series in 2000, the industrial sector returns equaled 7.6% per annum (Exhibit 1).
High Income Return
One of the most attractive features of logistics real estate as an asset class is its high income return. The level and stability of the income return offered by logistics remains attractive to a number of investor types, especially those with liability matching mandates. According to CBRE, logistics delivered 7.6% in direct return over the last 10 years; this is 200 basis points and 240 basis points above the direct return component of offices and retail, respectively (Exhibit 2).
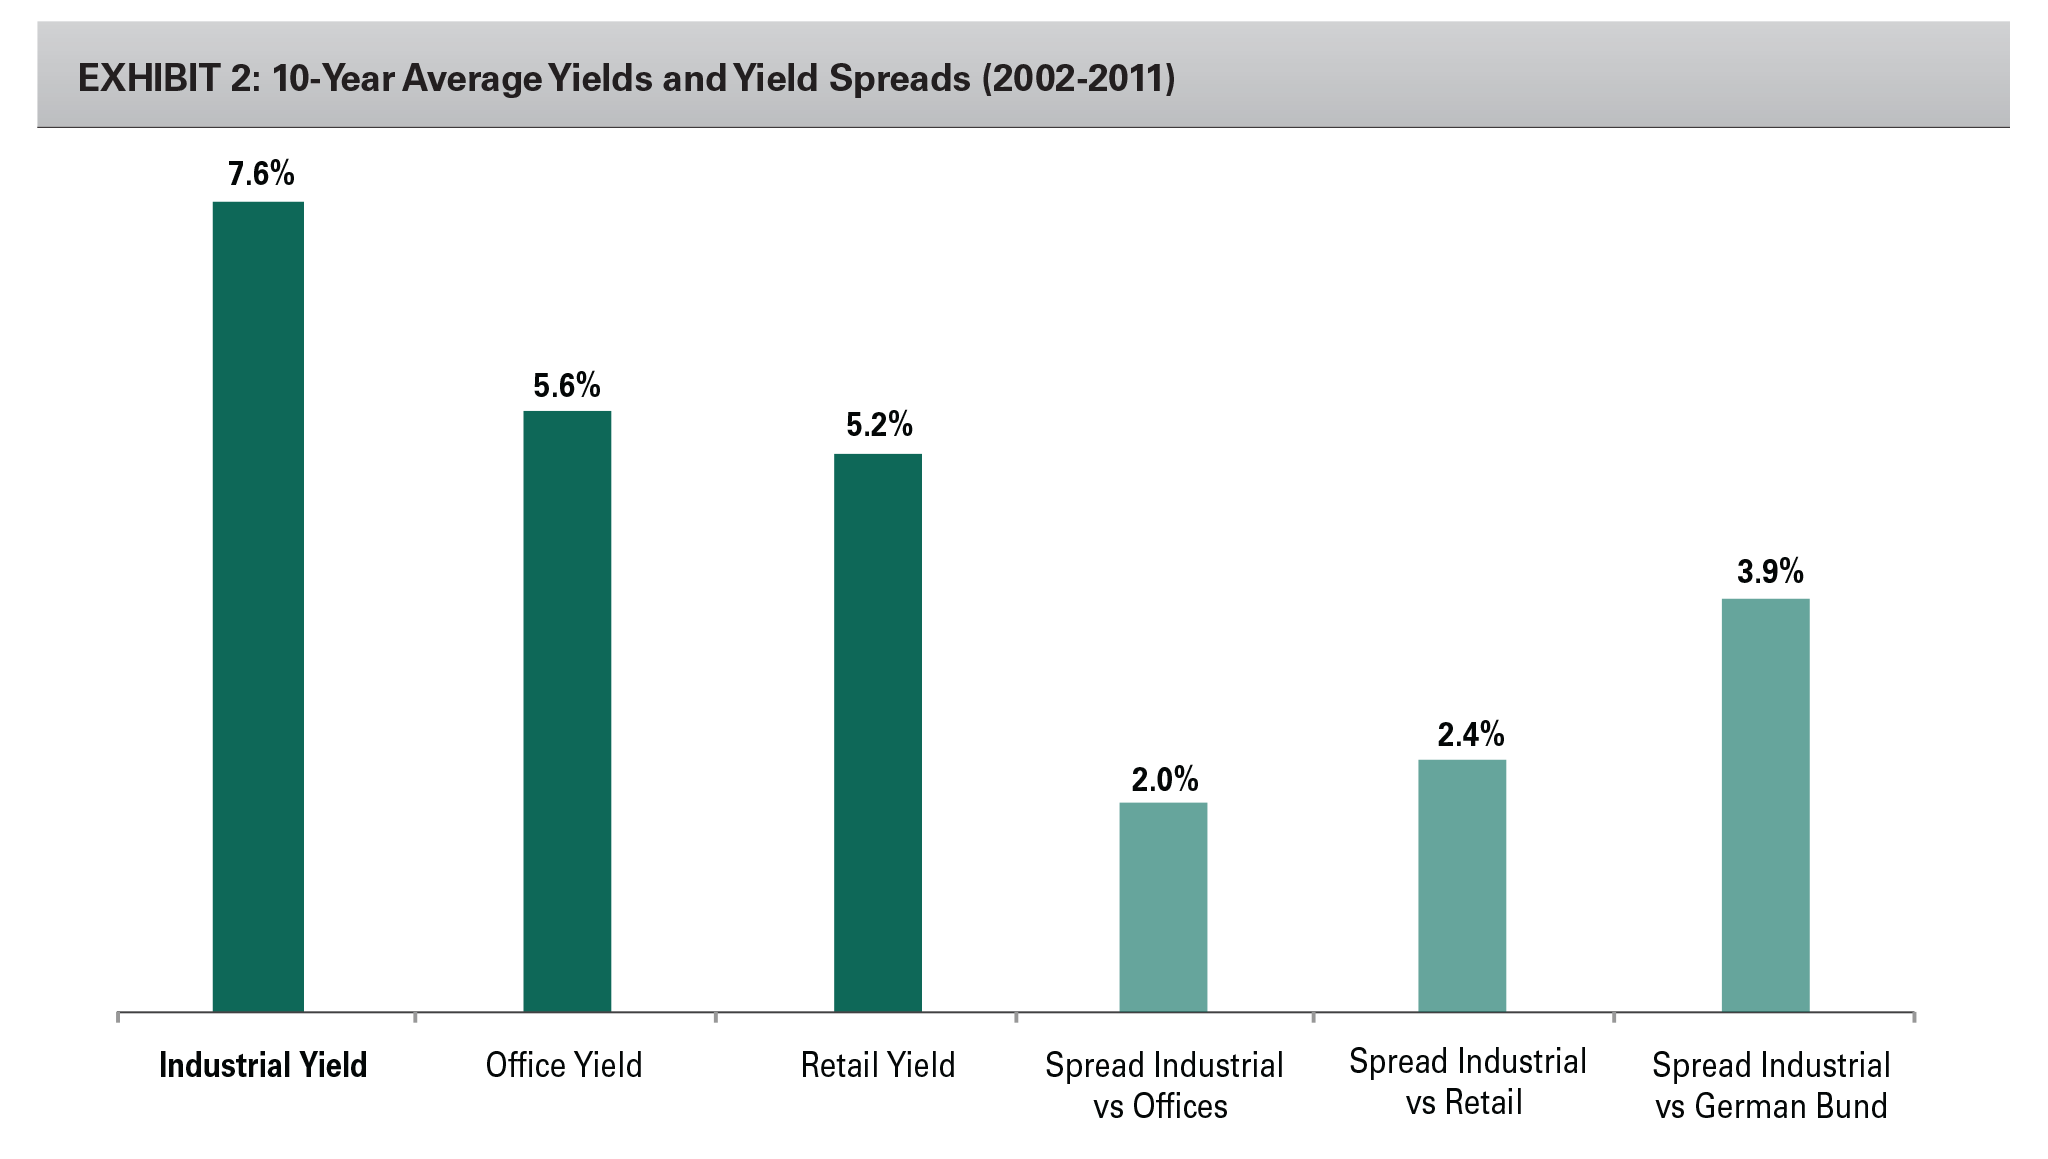
While the spread over offices compressed to about 150 basis points at the peak of the market in 2007, logistics clearly outperforms on a current income basis. This higher current yield gives logistics a buffer against economic volatility and provides a cushion to increasing financing costs. Furthermore, spreads over the risk-free rate (German bund) have increased significantly during the last few years following an increase of logistics yields and a decline in bond yields.
Low Volatility
Along with much less pronounced development cycles, logistics has been the least volatile of the three sectors with the lowest standard deviation of historic capital value and rent growth. This underscores the defensive nature of logistics as an asset class compared to the more cyclical nature of the office markets. Supply in the logistics sector is relatively easy to switch off, which has led to this lower degree of volatility in terms of rental growth, and to a lesser extent in total returns.
In summary, of the three primary property sectors, industrial was the second-best performer in terms of total return over the last 10 years in Europe, after retail. However, logistics also proved to be the least volatile of all three sectors, as measured by the standard deviation of 10-, 15-, 20- and 25-year historic capital value growth. Exhibit 3 presents an overview of the historic total return for each of three main commercial property classes relative to the volatility in capital value growth.
Diversification Opportunities
Although international real estate may not be impervious to a global real estate market downturn, real estate still provides attractive diversification opportunities for a mixed-asset portfolio. These can be found in international real estate markets. Many studies have already proven that there are major benefits of global diversification. However, within Europe there are also benefits to diversify where there is a low correlation between markets and a significant difference in the risk/return profiles for each of the markets. Volatilities and correlations of international markets indicate the ability for diversification and risk reduction on a European level. European countries have different economic and property cycles, and hence timings of these cycles are not perfectly synchronized. Although European industrial returns have often tended to move in the same direction during an upturn, the differences increase in a downward cycle. This suggests that European diversification in industrial real estate provides protection over periods where diversification would be most beneficial. In addition, as each individual industrial asset is relatively inexpensive – both from a purchase and a development standpoint – investments are well-spread, making it an ideal sector for diversification.
WHAT DRIVES DEMAND FOR INDUSTRIAL REAL ESTATE IN EUROPE?
Drivers of demand can be categorized as macroeconomic (or cyclical) drivers and structural drivers. Gross domestic product (GDP), private consumption and trade are the leading macroeconomic drivers of industrial demand, and while we expect these indicators to remain volatile in the short term, the medium- and longer-term forecasts bode well for the sector. Drivers of demand in industrial in Europe are more structural than cyclical. Trade and supply chain reconfiguration are expected to continue to be the most important demand drivers in Europe.
Macroeconomic drivers – GDP
A region’s expected GDP – and the consumption ultimately fueled by it – is often a starting point in analyzing future demand for logistics space. Despite lingering economic and financial softness in Europe, the relationship between GDP and industrial real estate demand remains intact. The central idea is that when an economy in a particular region is keeping income levels low, any growth in consumption remains low. However, when GDP rises and GDP per capita exceeds a certain level (often the result of a growing middle class), increased income begins to change patterns of demand and push economic activity into a new, high-growth phase. For the European Union (EU), overall GDP growth is forecast to be flat in 2012, increase in 2013 and outperform the 10-year historic average from 2014. Within these forecasts, there is divergence between the growth rates of individual countries.
Macroeconomic Drivers – Consumption
Private consumption – historically the largest component of GDP – has a long-run correlation with GDP. In the eurozone, consumption contributes 58%. This is lower than domestic-oriented economies such as the U.S., where private consumption accounts for about 70% of GDP. We expect private consumption will continue to be restrained in the near term, driven by high unemployment, slow growth of real incomes and high precautionary savings, as well as high household debt in a number of EU member states. With the expected return of confidence, stabilizing labor market conditions and real disposable income growth supported by abating inflationary pressures, private consumption is set to accelerate gradually from 2013 and to expand further in 2014. Overall, EU private consumption is forecast to compress by 0.6% in 2012 and to recover by 0.4% in 2013, after which a stronger rebound of 1.9% per annum on average is expected in the 2014-2016 period.
Macroeconomic Drivers – Trade
The world is increasingly divided into trade blocs that play a central role in international trade negotiations. The EU has become the world’s largest trading bloc and generates the highest nominal GDP worldwide. However, the EU is an economy with a relatively larger total population base (approximately 504 million), which implies a lower GDP per capita. Europe represents just 8% of the world’s population but it accounts for 38%, or $13.45 trillion, of merchandise exports and imports, making it the largest contributor to world trade. Five European countries are within the world’s 10 largest exports/importers. In addition, the EU is the largest trading partner of a number of large (emerging) economies, including China, India and Russia.
In 2011, net trade contributed positively to economic growth in the EU and the euro area. The challenging economic situation in the EU – in particular, the weakening of domestic demand – has weighed strongly on imports. The forecast is bright, however; and the outlook for export and import growth of goods implies a continuation of positive growth in net trade.
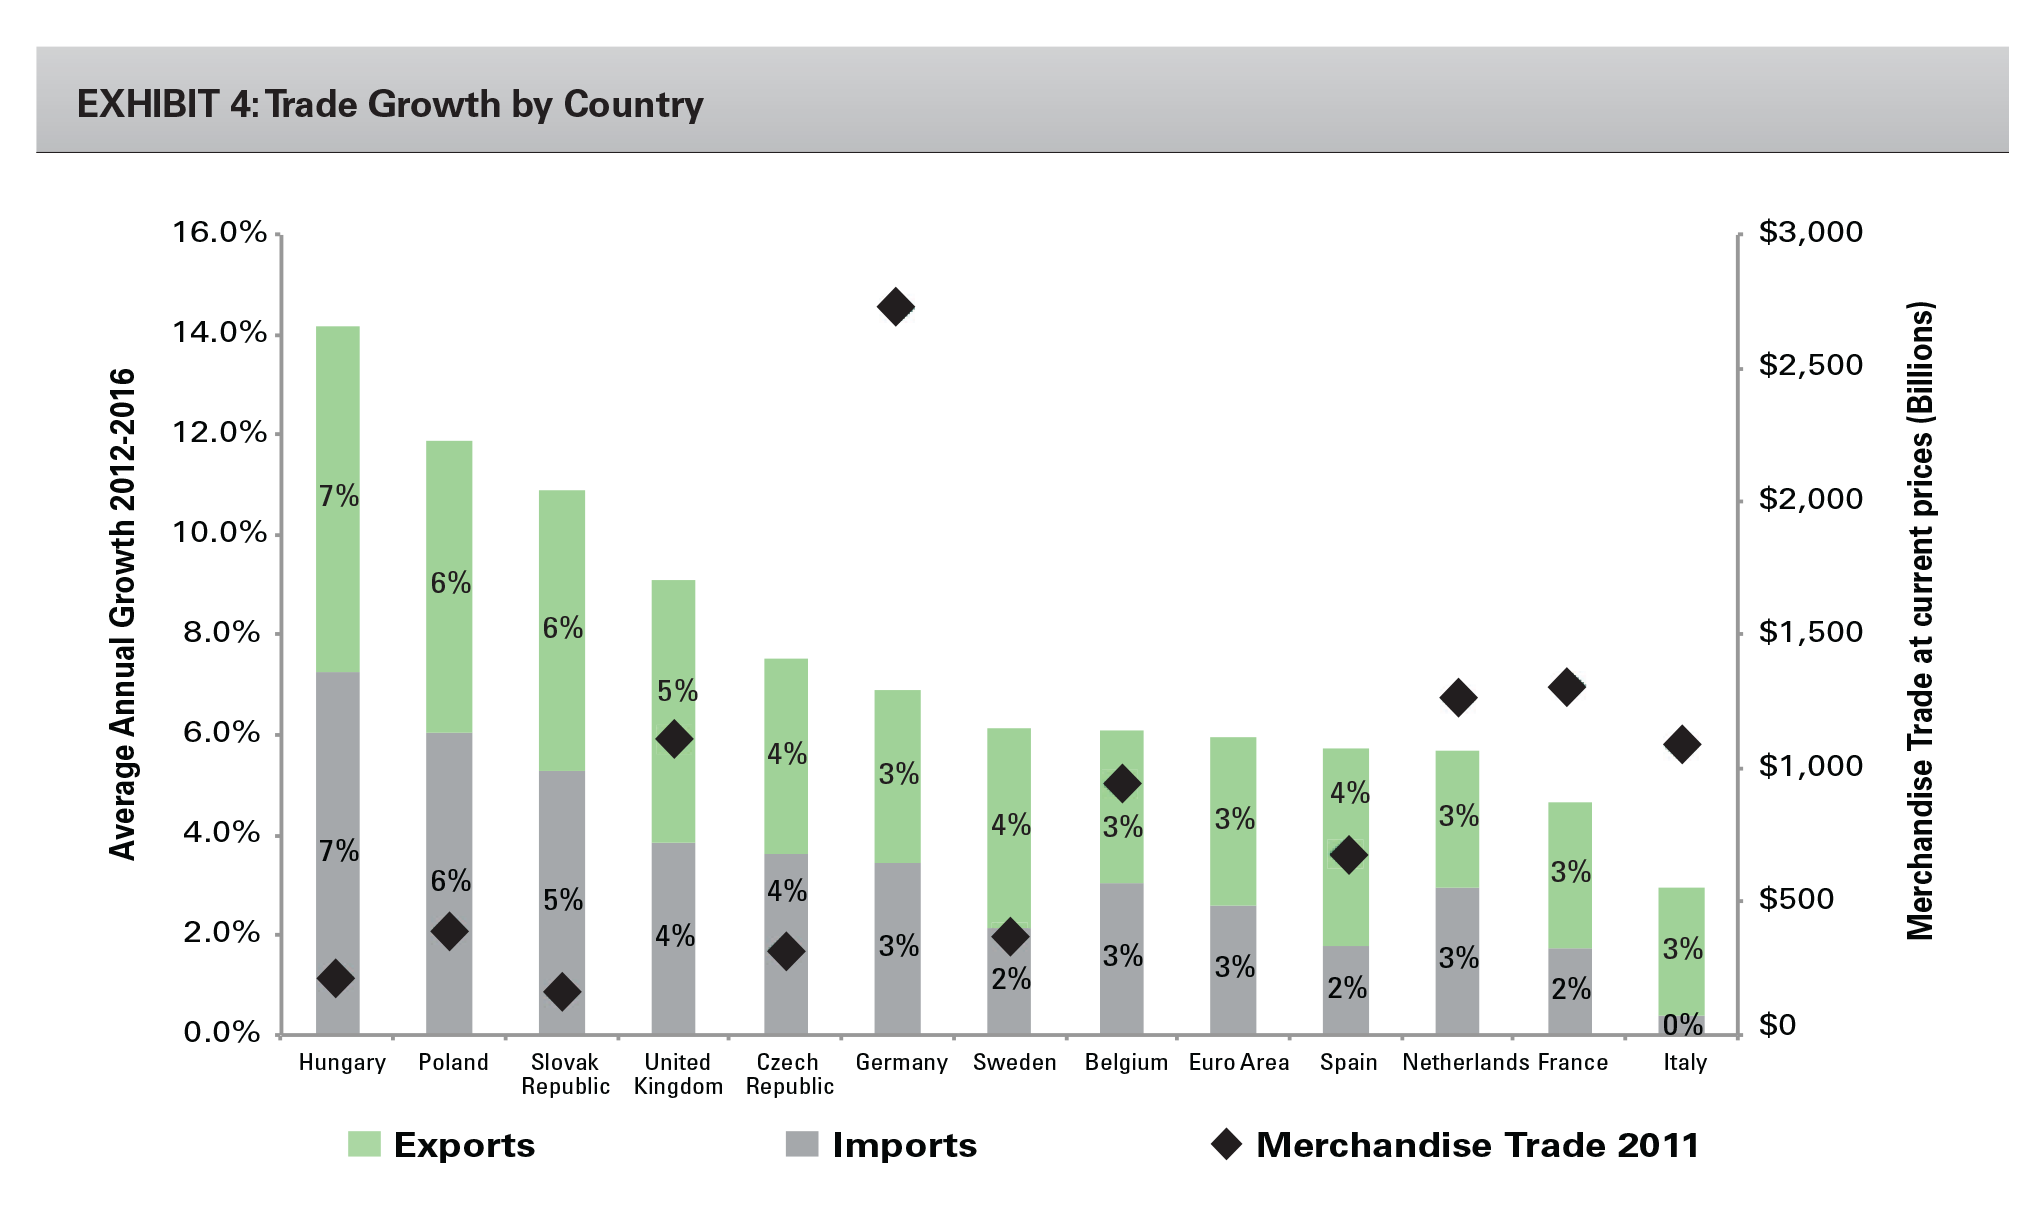
For the period 2012 to 2016, trade forecasts across all European regions are favorable, and for most are above the average growth figures between 2007 and 2011. IMF forecasts average annual export growth between 3.0% (Southern Europe) and 5.6% (Central Eastern Europe) through 2016, with 3.4% expected for Northern Europe. Highest export growth figures for the next five years are expected to be in Hungary (6.9% average growth), Poland (5.8% average growth), and Slovakia (5.6% average growth), while the lowest export growth is expected in Italy (2.5%) and France (2.9%), although they come from a high nominal base (Exhibit 4).
Within Europe, the opening of national borders has enabled companies to pursue regional or pan-European distribution networks as opposed to their former country-by-country approach. In regions with less mature industrial markets, distribution remains more decentralized to address the emergence of new markets. The progressive change that has occurred over the past decade or so has been extraordinary, and the demand for distribution centers and logistics facilities with increasingly transparent and controlled inventory, highly efficient site plans and reduced labor costs continue to gain momentum. This, in combination with growing retail markets in Central Eastern Europe (CEE), has shifted the distribution, and to a lesser extent the consumption point of gravity, slightly eastward. Based on a number of criteria, including the logistics market size, openness of the economy and forecasted five-year GDP growth, the European logistics market can be segmented into four clusters.
- Large Transportation Countries with a Domestic Focus: Countries such as the U.K., Spain and France have a high population with a domestic-based economy; therefore, most of the distribution centers serve the local and domestic markets.
- Traditional Gateways with a European Focus: The open economies of Belgium, Germany and the Netherlands benefit from their geographical position within Europe and are viewed as the European gateways. With the presence of Europe’s largest seaports like Antwerp, Hamburg and Rotterdam, good hinterland links and a good proximity to a large consumer base, these countries have a larger presence of European distribution centers (EDCs).
- Regional Markets with Open Economies: Countries such as the Czech Republic and Slovakia, and to a lesser extent Sweden, have a high export share. These markets are rather small in size, and most distribution centers mainly serve the region and local markets. Economic growth forecast for these countries remains strong and is expected to significantly exceed the EU average.
- New Logistics Market with Strong Prospects: Poland has emerged as a major force in the European logistics scene over the last 10 years, benefiting from new infrastructural developments, manufacturing and consumer demand growth. Today it is by far CEE’s largest logistics market. Going forward, this strong growth is expected to continue on the back of strong GDP prospects and continued investments in infrastructure. Poland counts a high number of regional distribution centers (RDCs), local distribution centers (LDCs) and national distribution centers (NDCs), attributable to its large consumer base and its central position between Eastern and Western Europe.
Structural Drivers
The steep rise in transportation volumes as a result of increased globalization (world trade), innovation and technology, consolidation, rising energy and transportation costs, outsourcing of logistics activities to third-party logistics service providers (3PLs) and the significant growth in online retail spending are all strong structural shifts driving strong demand in the sector and have forced many companies to reconfigure their supply chain networks. The percentage of customers leasing modern logistics space is growing and global corporations need distribution facilities on multiple continents. As they grow, supply chain optimization is of paramount importance and enables companies to reduce labor and inventory costs while increasing service levels.
Many of these forces have been magnified by the changes within the European continent, where an eastward shift in the production and, to a lesser extent consumption, has caused changes in supply chains and an increase in demand for logistics services. Shorter delivery time requirements, growing transportation costs and the extension of supply chains in Europe are drivers behind a regional-based distribution model that is more focused on transport costs rather than on inventory and labor cost optimization. With transportation costs accounting for approximately 50-60% of total logistics costs and the long-term prospects of further increases, it will continue to drive network changes.
The reconfiguration of supply chains leads to an increase in replacement demand and therefore a move from multiple, smaller and more obsolete assets into larger, more efficient warehouses to create supply chain efficiencies and drive significant costs out of the supply chain. In determining an optimal network, shippers and 3PLs are striving to achieve the lowest total costs of ownership and overall logistics. These structural changes also provide new opportunities for the industry as a whole. This section presents an overview of the industry-specific drivers for the logistics industry and an outlook for the future. The most key supply chain management trends and factors that impact the design and redesign of global supply chain networks include:
- Globalization
- Innovation and technology
- Consolidation
- Outsourcing
- E-commerce
Structural Drivers – Globalization
The removal of barriers to the movement of goods, capital, services, people and information has made access to global sourcing alternatives worldwide possible and accelerated global commerce. This has led to a long-term shift of world merchandise trade, with the share of manufactured goods rising substantially, against a decrease in agricultural products and nonfuel minerals. As a result, the dominance of the Western developed countries in world exports of manufacturers has been to a great extent diluted. The production of labor-intensive goods and, subsequently, electronic products and capital-intensive goods were outsourced to more cost-effective countries, particularly China and CEE, which has had a deep impact on the demand for logistics services. Markets became increasingly interlinked on the global level, leading to longer, more complex supply chains. At the same time, more and more goods are being produced, transported and sold around the world to meet ever-changing consumer expectations.
Over the last 50 years, global trade has not only moved in tandem with GDP, but more importantly, has grown at more than three times global GDP, a trend many economists expect will continue for decades. Trade is more volatile than the overall economy, as it is composed largely of the more volatile components of consumption, such as durable goods. It is quicker to reduce imports than to ramp down domestic production of goods.
Structural Drivers – Innovation
The rise of new information and communication technologies has led to more transparency in the supply chain and an acceleration of goods flow. The globalization of supply chains has led to longer distances between factories and markets. As a result, many companies have implemented extensive technologies to ensure effective and efficient supply chain management and introduce greater flexibility and agility into their logistics network.
Improvements in information technology have led to falling inventory-to-sales (I/S) ratios over the last decades, as firms’ drive for efficiency has enabled them to expand sales with a smaller inventory. This has resulted in goods moving faster through the supply chain, thereby making high-throughput distribution facilities that much more valuable.
Structural Drivers – Consolidation
Globalization has also led to an increase in the number of mergers and acquisitions (M&As) among 3PLs. These M&As are triggering the redesign of supply chains. In Europe, the logistics industry itself is adapting to the needs of pan-European distribution through consolidation. In the 1990s, the number of 3PLs grew substantially, as companies entered the market for the first time. The need to provide a truly pan-European network, allied to continuous pressure upon logistics costs within the supply chain, has forced rationalization on the industry. Over the last 10 years, the European transport and logistics market has been transformed by a large number of acquisitions that have begun to consolidate. Demand for larger warehouse facilities is not expected to slow down in the near future, mainly due to the fact that the process of consolidation of the networks is not yet finalized for many shippers and 3PLs. As previously discussed, the competing forces of reducing total supply chain costs and improving service levels comprise a pair of trade-offs in optimal network choice. The number and location of warehouses are therefore critical decisions. Reducing the number of warehouses while consolidating into larger facilities allows these companies to save on labor, real estate and inventory costs, at the expense of higher transportation costs due to longer average transportation runs.
Given that the majority of industrial stock in Europe remains obsolete and therefore doesn’t meet the standards of warehouse users, there is a pent-up demand for modern warehouse space. Exhibit 5 illustrates this by comparing the modern stock per capita ratio for several submarkets. European markets are generally underserved compared with the U.S. markets.
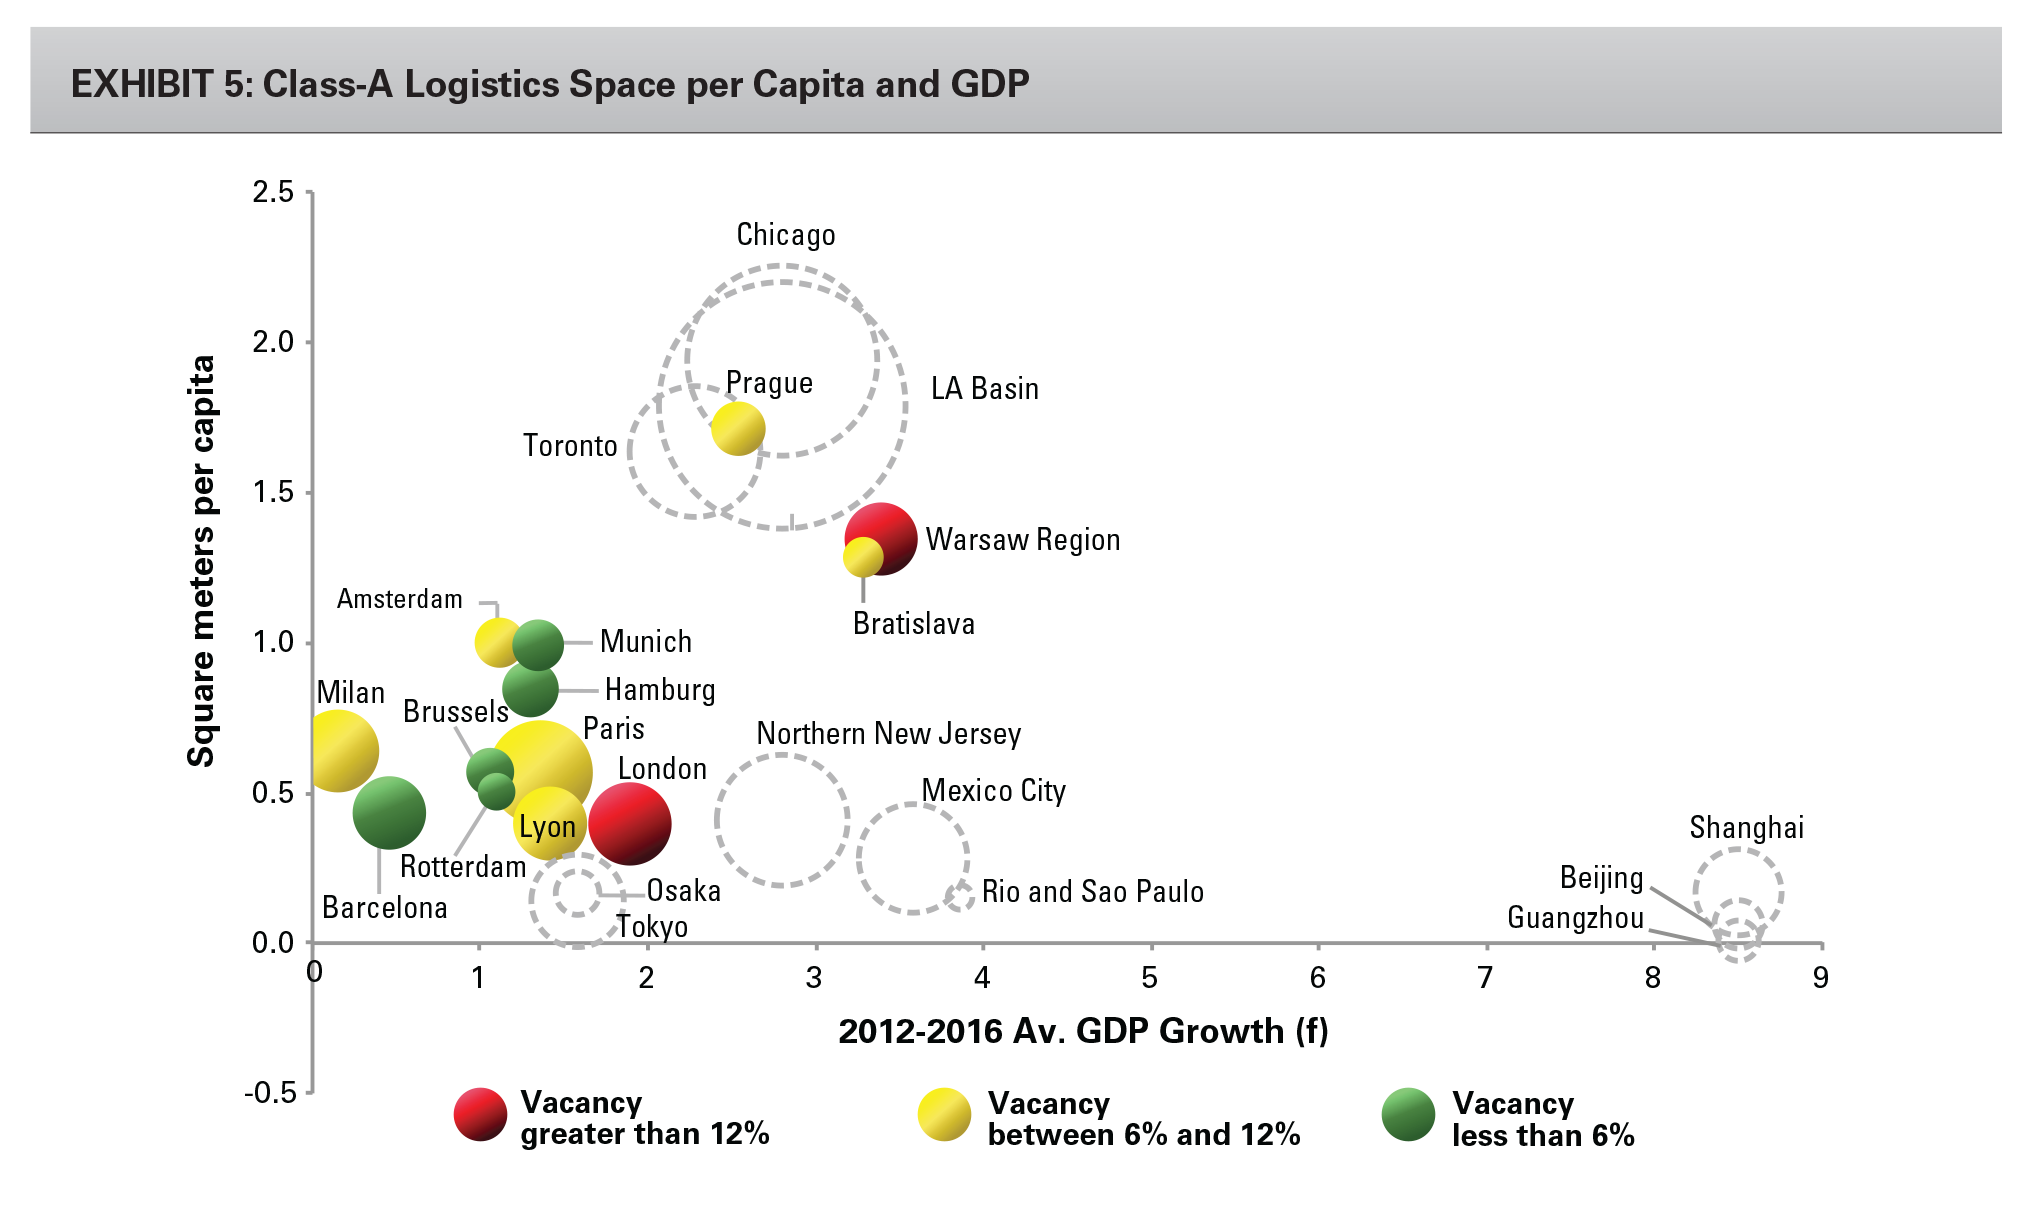
Overall, the modern stock proportion of total stock and the modern stock per capita ratio is lower than those of its U.S. counterparts. In fact, the U.S. counts over four times more modern warehouse space than Europe. The proportion of Class-A distribution space is very small and is approximately 14% of the total industrial stock universe in Europe. The ratios across Europe are mixed, with the lowest modern stock percentages in core Western Europe (Benelux, Germany, the U.K. and France), and the highest ratios in the CEE markets where the majority of modern stock was developed over the last 10 years. The amount of vacant, old and smaller units (often between 5,000-10,000 sqm) is large and still increasing, which shows that there is a mismatch between current available stock and demand for modern warehouse space.
Structural Drivers – Outsourcing
For more than 20 years, companies have constantly increased their efforts to lower costs and improve productivity. The transportation and warehousing of goods is capital and labor-intensive and can be performed much more cheaply by third parties. Furthermore, it allows for more flexibility during periods of economic downturns. This gave rapid rise to the specialized 3PLs and, as a result, the contract logistics business has grown by 9.1% per annum over the last 10 years. Despite strong growth over the last decade, the outsourcing of logistics activities is still relatively low in Western & Southern Europe, at just 32.3% in 2010, up from 27.7% in 2000, according to Analytiqa.
While the level of outsourcing varies across sectors and countries, it is expected to grow by 6.1% per year between 2011 and 2014, with the overall logistics market growing by nearly 5% per year over the same period, several times the rate of expected economic growth in the region. This trend toward outsourcing of logistics has changed supply chain configurations in Europe, increasing the share of 3PL demand. 3PLs have different spatial and asset requirements compared with owner-occupiers.
Structural Drivers – E-commerce
In Europe, consumers are becoming increasingly confident about shopping online, and e-commerce has gained a growing share of overall retail sales. The shift from retail stores to the Web has had a positive effect on demand for warehouse space, with retailers moving from a network of high-street shops to large, efficient distribution centers. In addition, the higher levels of reverse logistics traffic in e-commerce have a positive impact on warehouse floor space demand. As Internet adoption continues to grow and international retail markets mature, retailers have a tremendous opportunity to drive global profitability through their e-commerce strategy. The development of e-commerce will therefore require a reorganization of distribution channels. E-commerce sales of B2C goods in Europe’s three largest e-commerce markets—the U.K., Germany and France—almost quadrupled in the last five years. During this time, every additional € billion of sales resulted in an average additional warehouse demand of approximately 72,000 square meters. This conclusion is relatively consistent with a study done by DTZ Pieda for the U.K. market in 2000, where it was estimated that for every extra £700 million (approximately €865 million) of online sales, an additional 46,000-90,000 square meters of warehouse space was required.
Exhibit 6 illustrates the volume of additional annual online sales in relation to new Internet-led warehouse take-up in the U.K., Germany and France. E-commerce take-up in these countries showed impressive growth in the past five years and reached a record take-up volume of 1.2 million square meters in 2011. This is approximately 14% of the total registered national take-up in these countries.
Based on the projections of growth in online sales in Europe (12.2% compound average growth rate (CAGR) over the period 2012-2016 by Forrester Research), demand for Internet-related take-up is likely to continue at these rates.
WHY NOW?
Capital Values
The global financial and economic crisis of 2007 and 2008 has had a negative impact on property values in Europe, including the industrial property sector. According to CBRE data, industrial values in Europe have decreased by 21.9% on average from the peak of the market (generally Q3/Q4 2007) to the trough (Q2/Q3 2009). However, the performance was diverse across Europe, with some markets seeing falls in capital values in the 35-45% range (the U.K., CEE, Spain), while other more defensive countries, like Germany and the Netherlands, have witnessed peak-to-bottom value declines between 15-20%.
In addition, today’s industrial values are attractive compared with replacement values. When comparing Europe to the United States, some interesting differences can be seen. While the industrial property values, in the U.S. have declined by 32.9% from peak to trough the values have already recovered two-thirds of their loss. On a pan-European basis, industrial property values are back to 2005 levels, and have only increased by 1.3% on average since the cycle trough. Therefore, we believe the recovery of industrial should continue at a stronger pace compared with the other two sectors. As a result, current values provide an excellent entry point for the industrial market.
Demand
Despite a challenging economic environment over the last few years, the European logistics market has had two consecutive years of record take-up (Exhibit 7). Total take-up increased by 9% to 15.0 million square meters in 2011, reaching a new all-time high. Despite relatively low GDP growth in Europe over the last 10 years, take-up of warehouse space tripled and increased by a CAGR of approximately 13% in Europe over the same period.
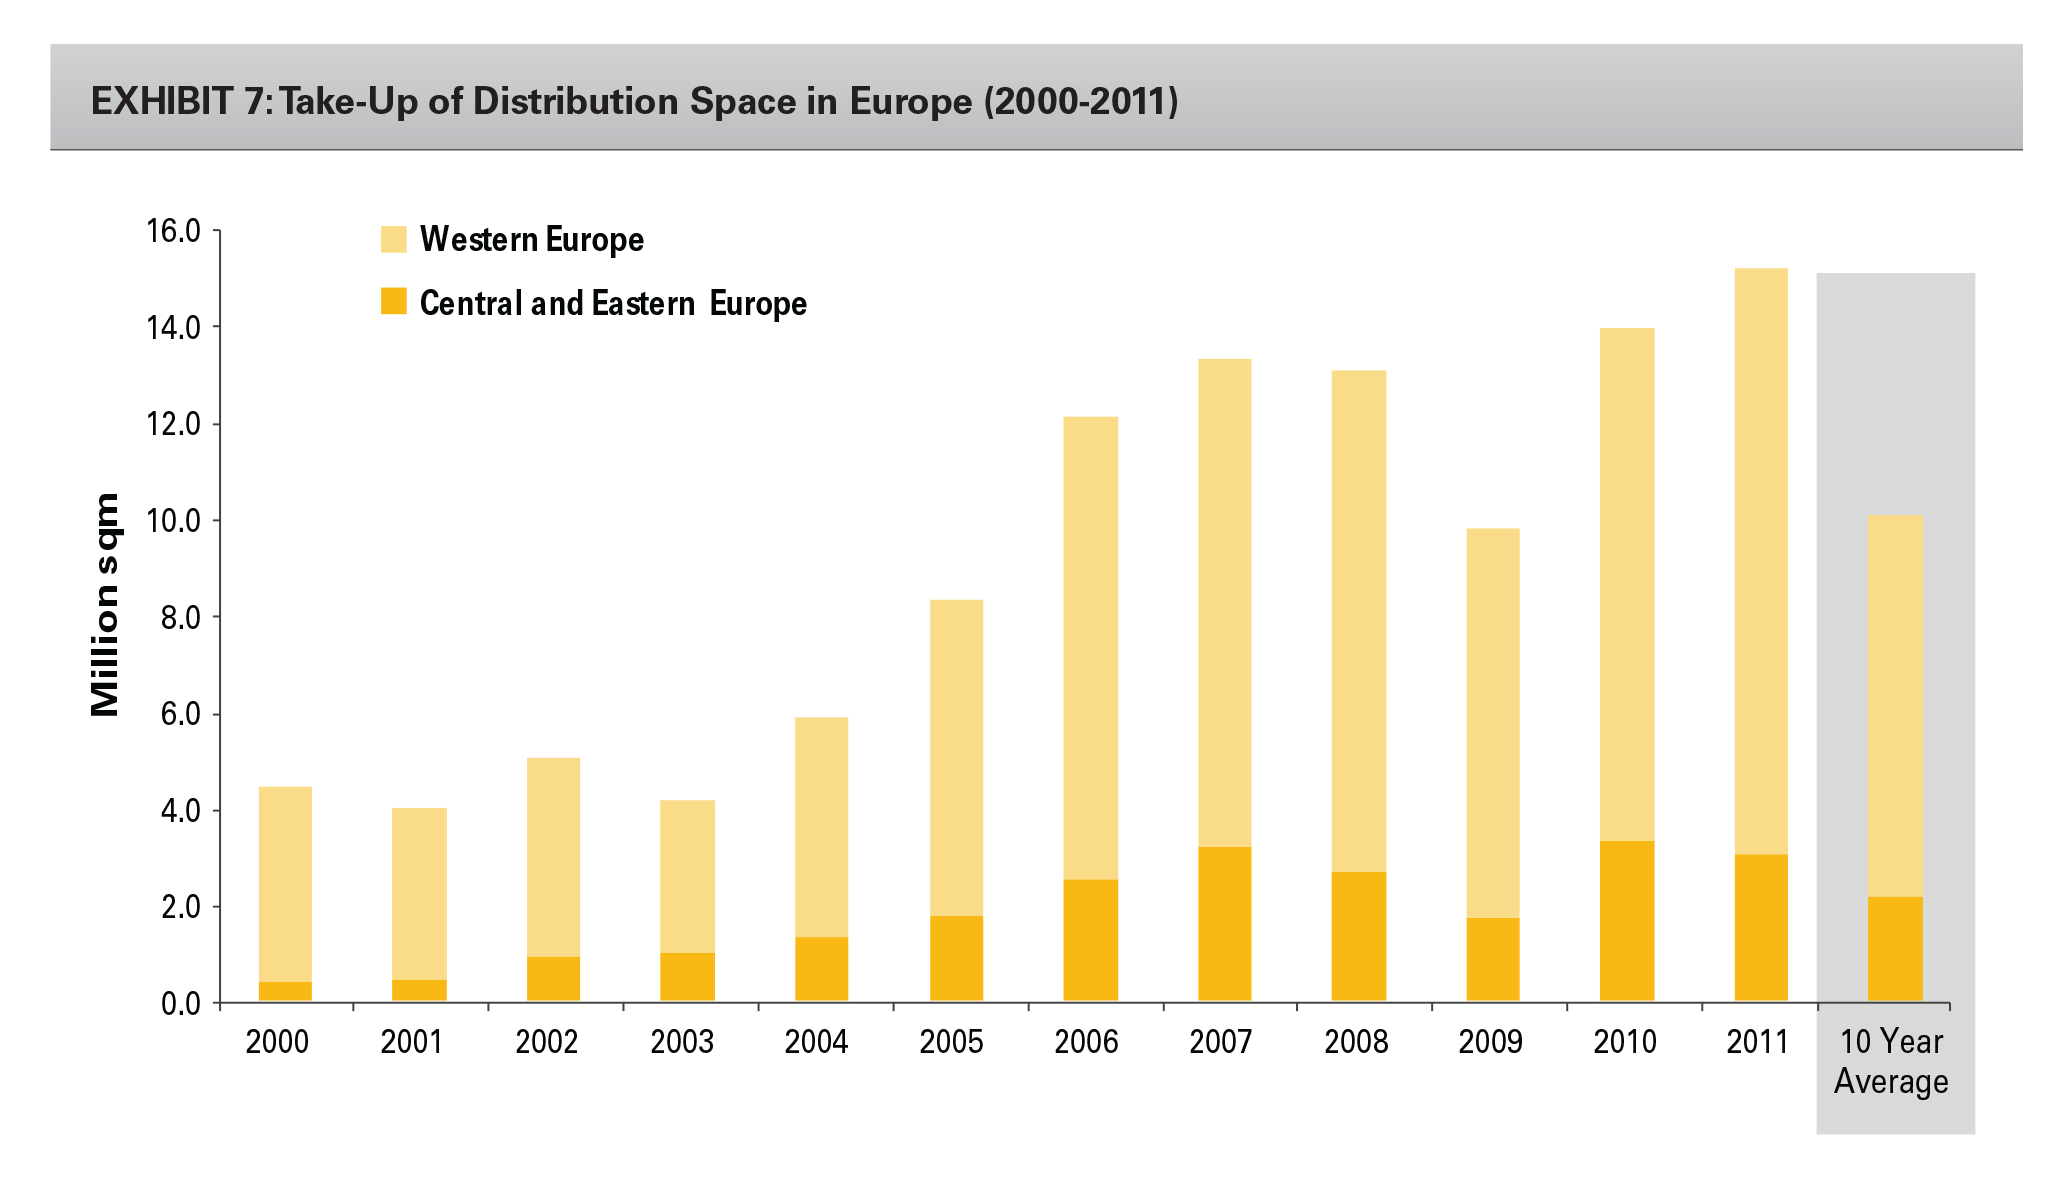
The CEE markets have clearly benefited from the globalization trend, with the share of the CEE in total European take-up increasing notably from 9% (or 400,000 sqm) in 2000 to 20% (approximately 3.0 million sqm) in 2011. In addition, the trends for consolidation and outsourcing leading to more leasing as opposed to owner-occupation, as well as the explosion in online retailing, have all contributed to strong demand for logistics units.
Supply
Supply levels of new warehouse space plummeted after the peak years of 2007 and 2008, reaching levels below the historic average. Contrary to the boom years, new supply mainly constitute build-to-suit deals (Exhibit 8). Prologis research reveals that just 8% of new development starts in Europe during 2011 were speculative, which is almost the reverse of what was seen during the upturn, where speculative schemes accounted for the vast majority of new developments. In an environment where development financing is almost nonexistent and foreseen to remain very limited in the near future, supply is predicted to remain tight and focused on pre-lets and build-to-suit transactions.
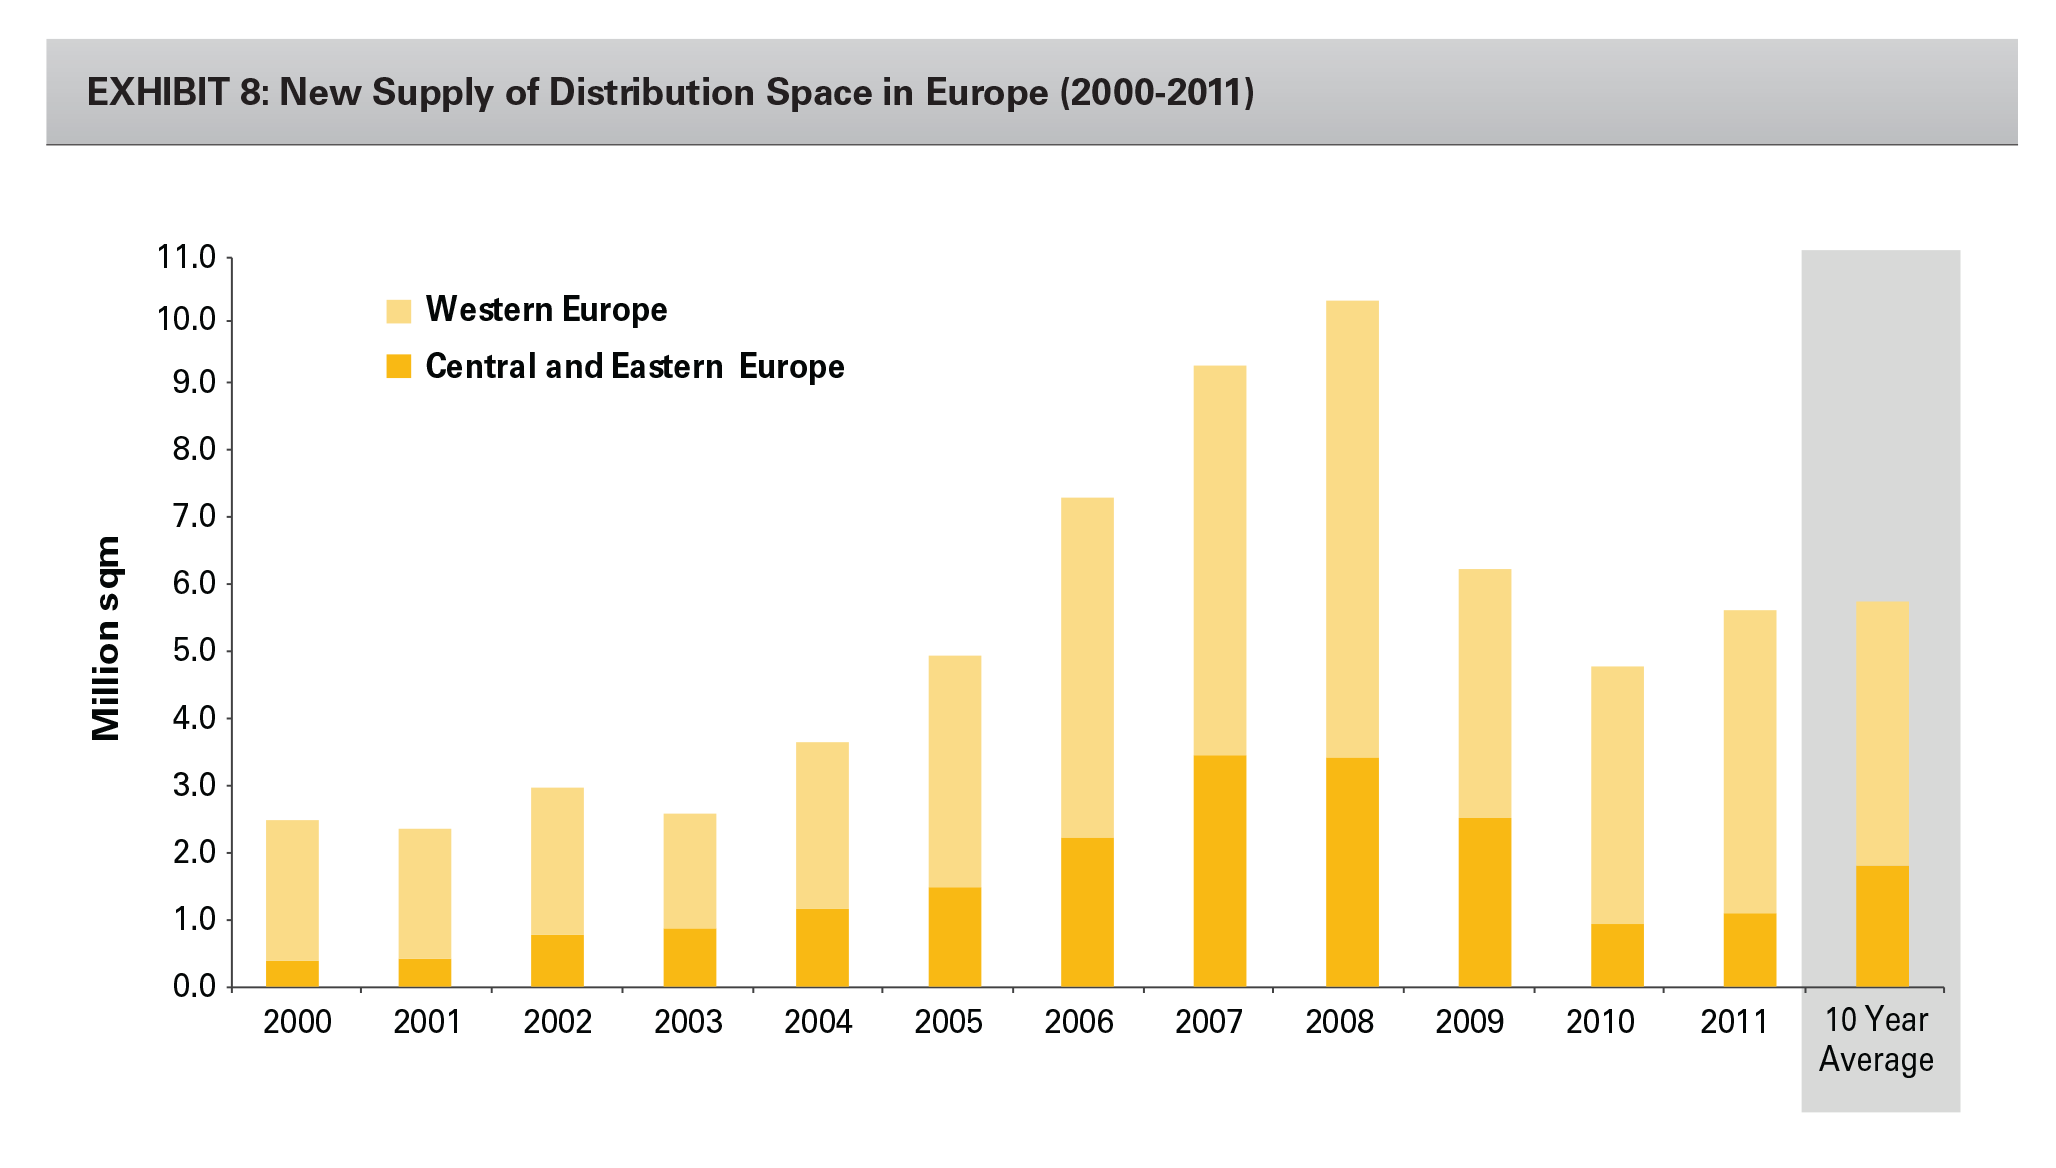
Increased demand for warehouse space outpaced new supply, driving up occupancy rates in Europe and supporting an increase in net effective rents in a selected number of markets. Pan-European occupancy rates have improved by 60 basis points to 89.1% in Q2 2012 compared with Q4 2011.
Rents
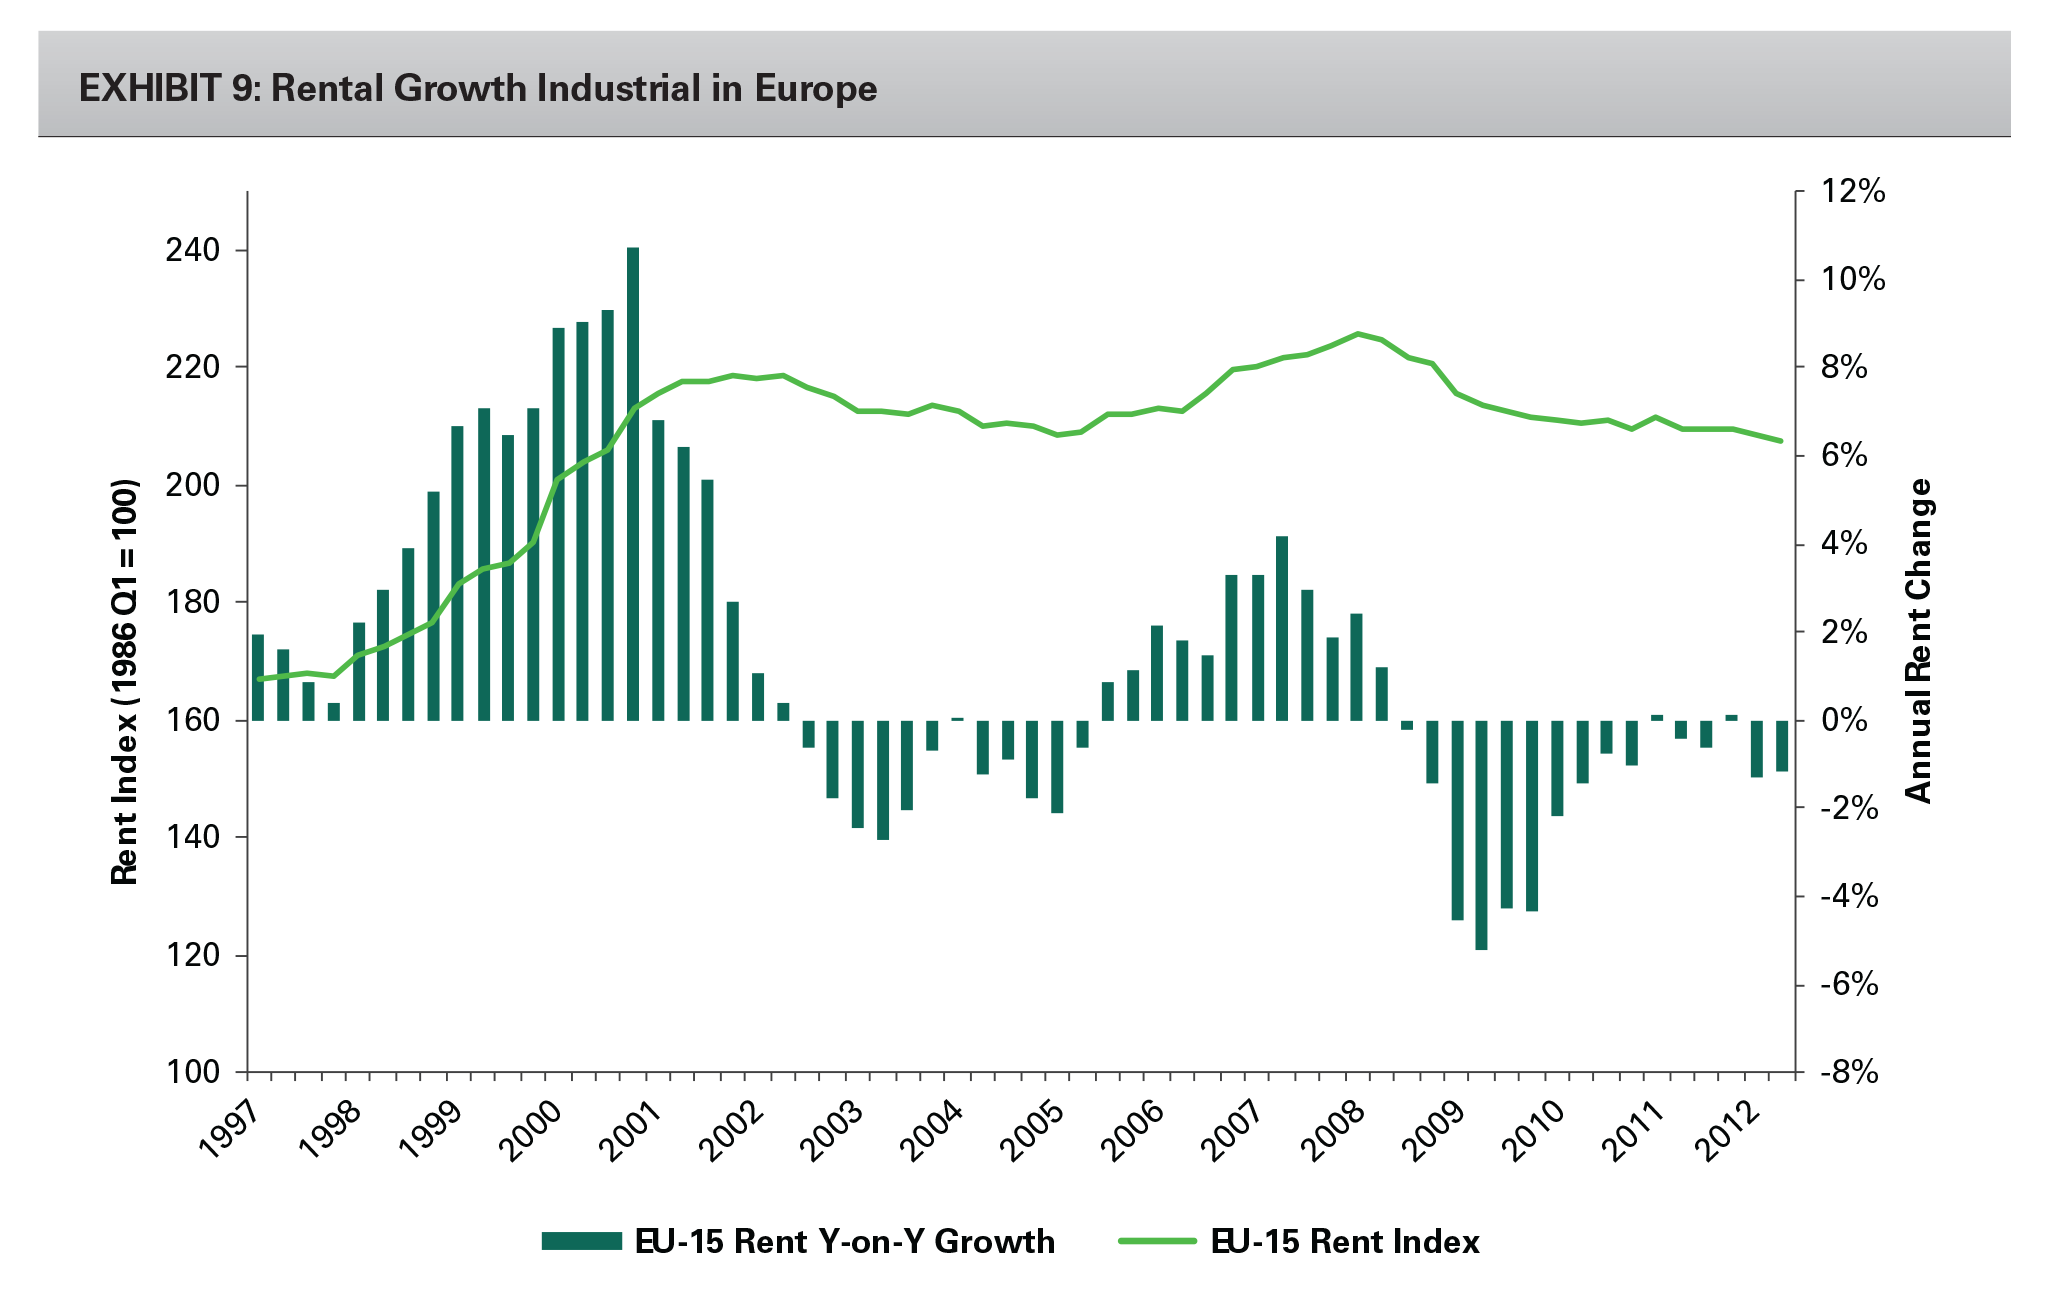
Most European markets have enjoyed positive net absorption over most of 2011 and the first half of 2012. This demand, coupled with historically low supply, has caused vacancy rates to fall and net effective rents to rise in a large number of markets. Rents in industrial real estate, as in all commercial real estate, move in cycles, but are generally stable. After reaching their peak in Q1 2008, rents declined across the board following the global economic downturn and the ensuing deterioration in demand (Exhibit 9). In Europe, prime headline rents have decreased by approximately 9% on average from peak to trough, and even around 20% on a net effective basis if you include rent concessions. However, prime rents reached an inflection point during 2011 and have begun to start growing again in a number of markets. We expect that improving market fundamentals, along with limited new supply, will continue to put upward pressure on rents in the coming years. With rents being well below nominal peak levels, and replacement cost-justified rents still above current market rents, we believe there is sufficient rent growth potential in Europe. Supply-constrained markets near larger population centers and port gateways are expected to see the highest rates of rental growth.
Yields
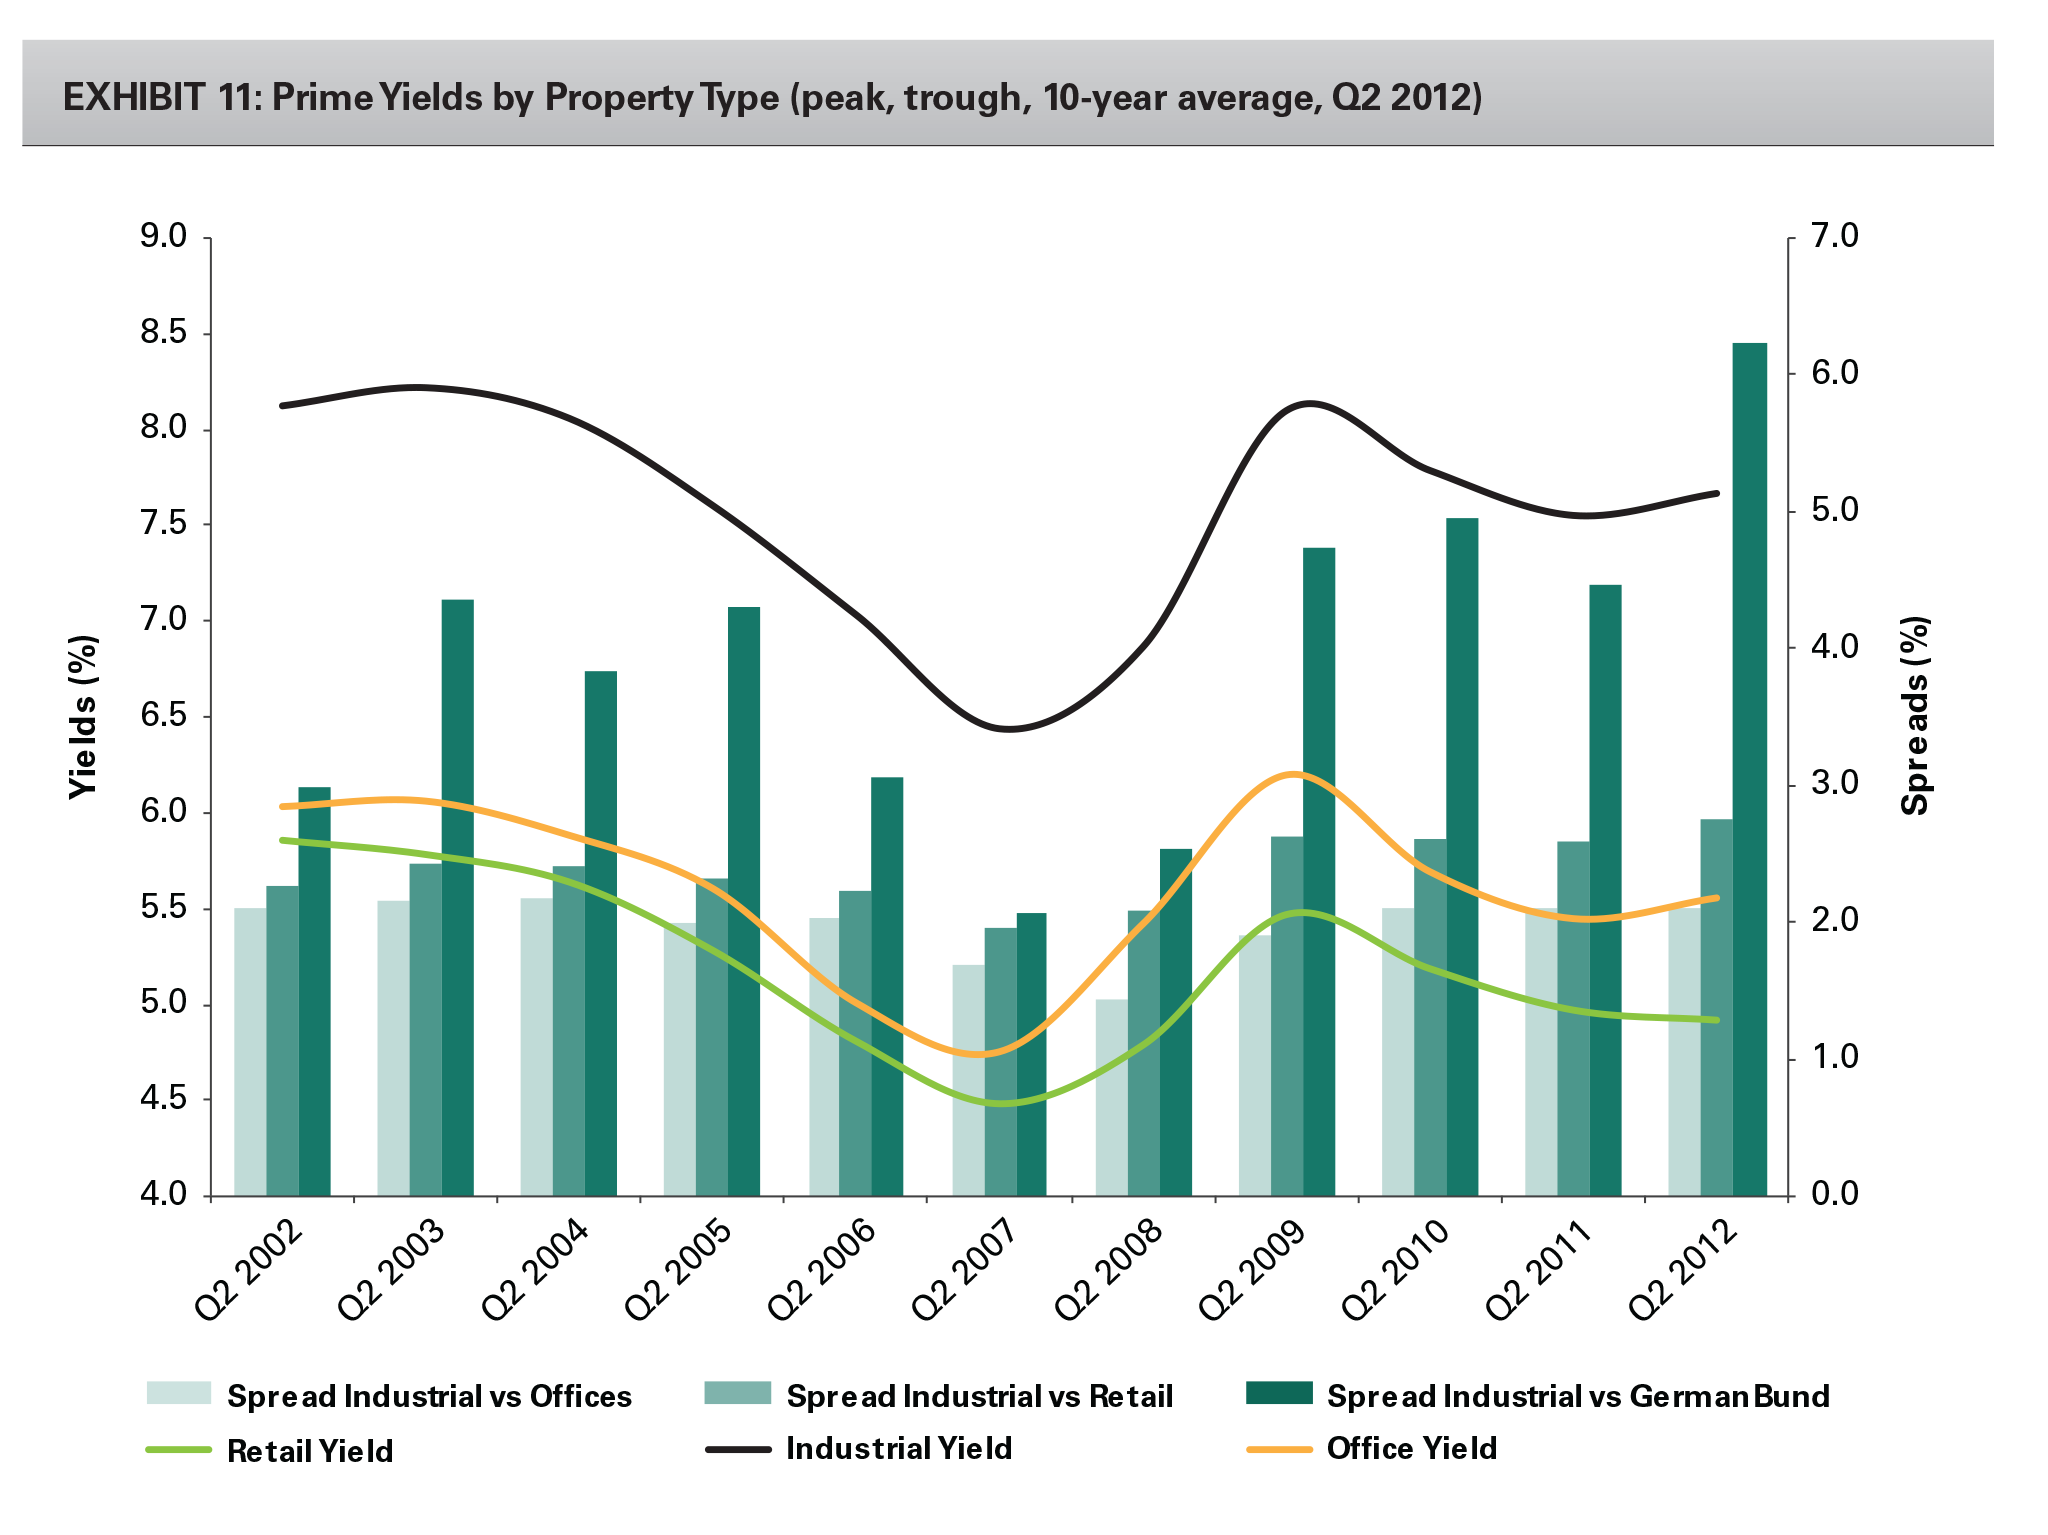
On a pan-European basis, logistics yields were reaching their trough at the end of 2007 and reached their cyclical peak in Q3 2009, after which they have started to move in. However, the rate of compression slowed toward the end of 2010 and in 2011, and yields have stabilized during the first half of 2012 (Exhibit 11). At the level of individual countries and submarkets, the pattern of yield shift for prime logistics varies quite considerably in degree and timing.
The scale of yield expansion ranged from 75 basis points in Germany to over 200 basis points in more volatile markets such as the U.K., Spain and the CEE. Overall, the European logistics market witnessed an outward yield movement of approximately 170 basis points during the downturn, of which 45 basis points have been regained in the last three years (Exhibit 10).
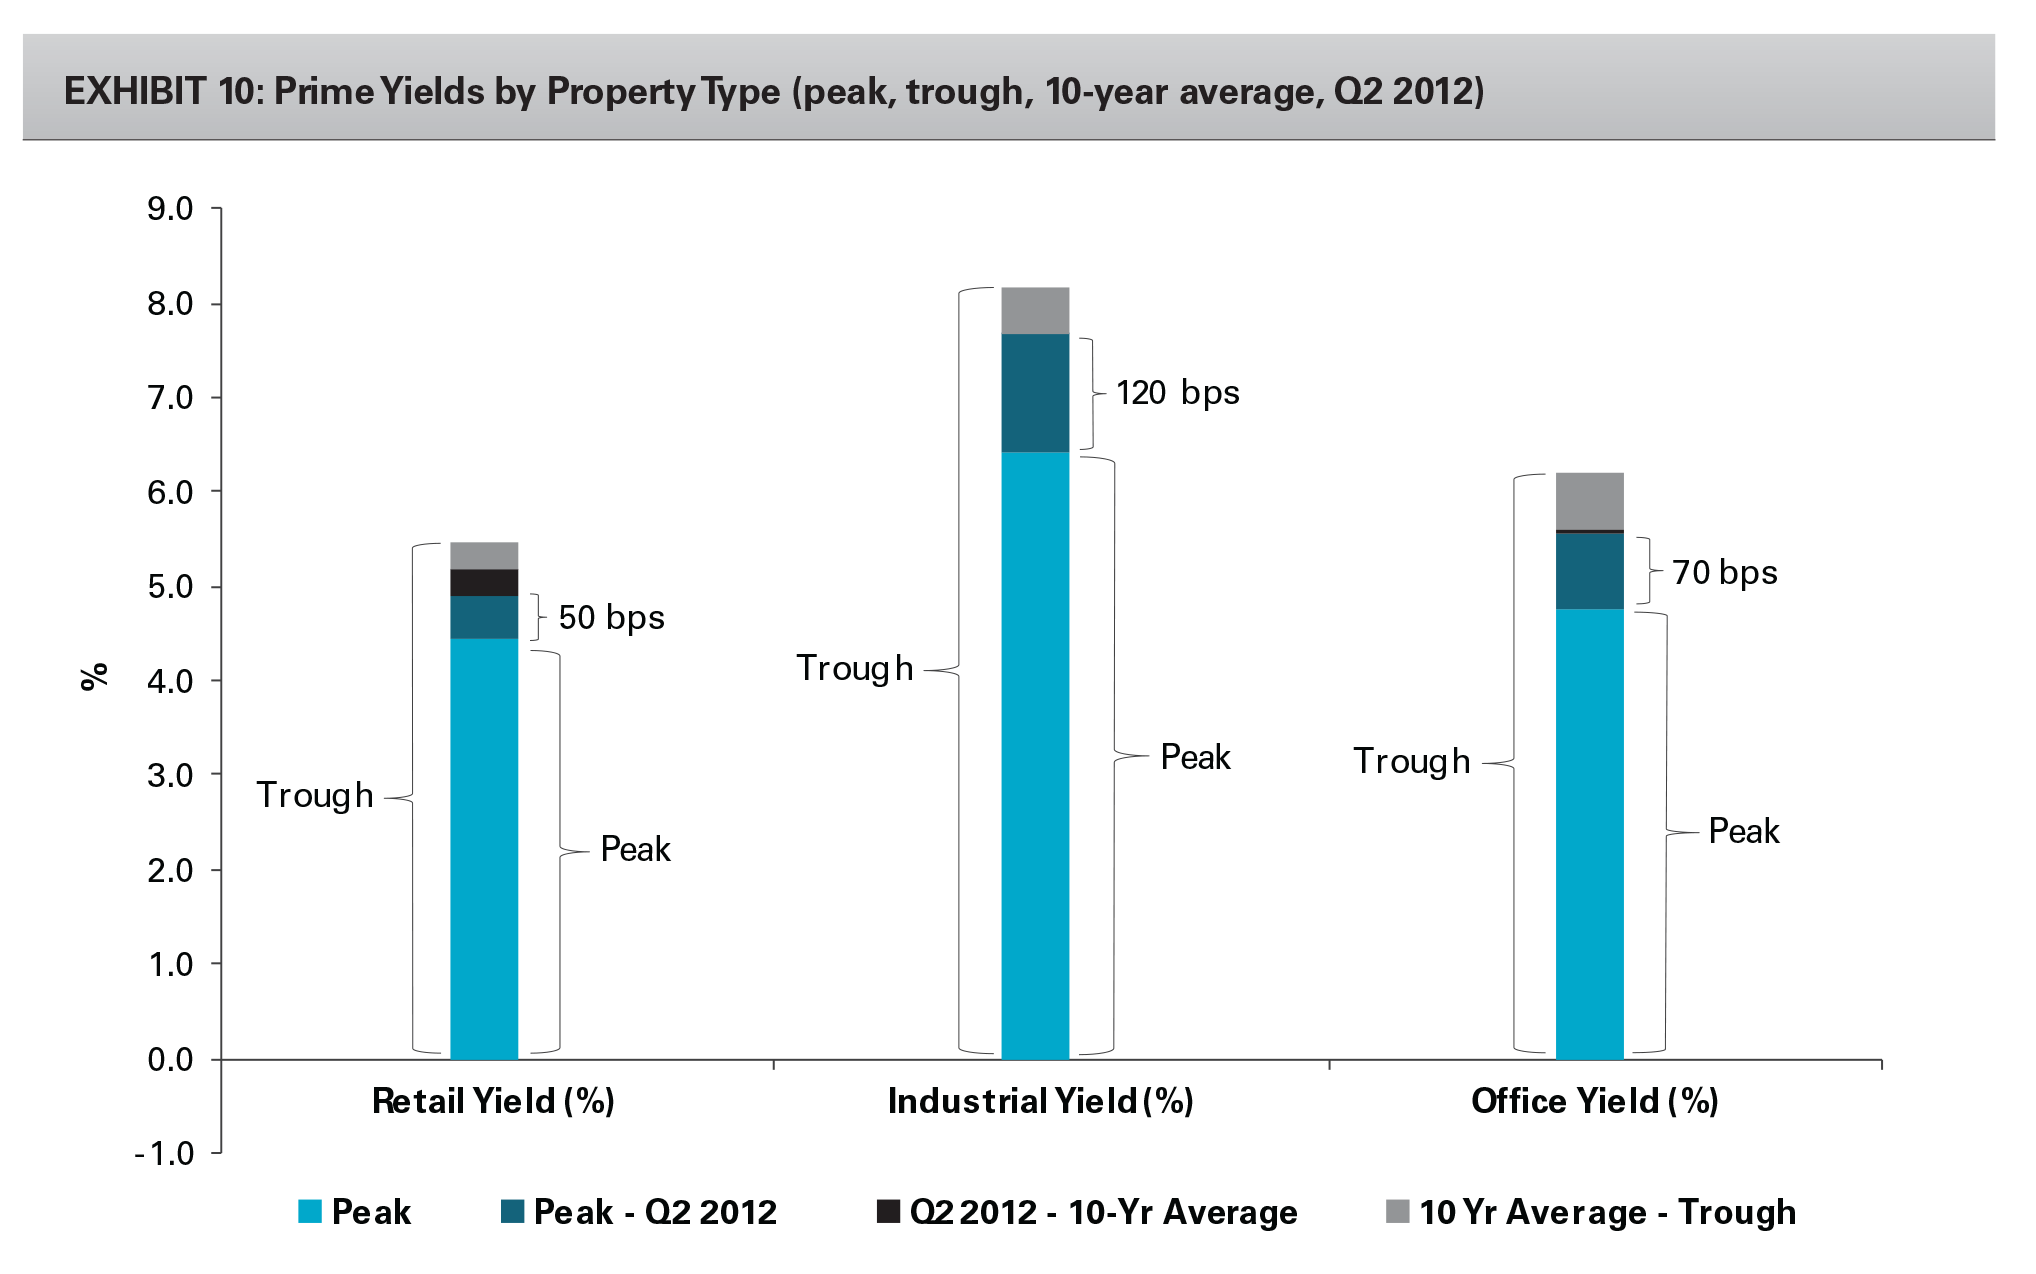
Prime yields have generally stabilized at an average of 7.65% in Europe, just above their 10-year historic average. Industrial is the only sector where yields are above the historic average, which implies more potential for inward yield movement once markets start to improve again.
As a result of industrial having the highest income return, the yield spreads are attractive. Risk premia for logistics assets vis-à-vis the risk-free rate (10-year German bund) have increased over the last three years despite a downward re-rating of logistics yields. In fact, this spread reached an all-time high in Q2 2012, standing at approximately 620 basis points. In addition, the logistics yield spread over office and retail remains attractive from a historic standpoint. Spreads between industrial and office have increased to roughly 210 basis points in Q2 2012 (Exhibit 11). Furthermore, industrial spreads over retail have reached a 10-year quarterly high of 275 basis points in Q2 2012. Excess yield spreads historically proved to be opportune entry points into the European real estate market and the logistics market in particular. We expect that yield spreads will continue to revert to and below the mean as the markets continue to recover.
CONCLUSION
Today the industrial real estate sector offers a favorable entry point, as rents have reached an inflection point in the cycle, yields are hovering around long-term averages and yield spreads are in excess of historic averages. However, more importantly, today’s values are attractive relative to peak and replacement values.
To capture the right investment opportunities in the market, it’s critical that institutional investors find an experienced provider of industrial real estate. With the right partner, the industrial logistics real estate sector offers them a wide variety of advantages that merit its inclusion as a critical component of a well-balanced global investment portfolio. These advantages include: comparatively high total returns including a high income component; its defensive characteristics; portfolio diversification; cost-effectiveness; and a steady source of demand. Industrial space is, and should continue to be, a key contributor to productivity enhancement, cost reduction and overall supply chain strategy. This continuous drive toward greater operational and cost efficiency will benefit industrial real estate, fueling the sector through its near-term recovery and well into the future.
Footnotes
- Source: JLL
Forward-Looking Statements
The statements in this presentation that are not historical facts are forward-looking statements within the meaning of Section 27A of the Securities Act of 1933, as amended, and Section 21E of the Securities Exchange Act of 1934, as amended. These forward-looking statements are based on current expectations, estimates and projections about the industry and markets in which Prologis operates, management’s beliefs and assumptions made by management. Such statements involve uncertainties that could significantly impact Prologis’ financial results. Words such as “expects,” “anticipates,” “intends,” “plans,” “believes,” “seeks,” “estimates,” variations of such words and similar expressions are intended to identify such forward-looking statements, which generally are not historical in nature. All statements that address operating performance, events or developments that we expect or anticipate will occur in the future — including statements relating to rent and occupancy growth, development activity and changes in sales or contribution volume of developed properties, disposition activity, general conditions in the geographic areas where we operate, synergies to be realized from our recent merger transaction, our debt and financial position, our ability to form new property funds and the availability of capital in existing or new property funds — are forward-looking statements. These statements are not guarantees of future performance and involve certain risks, uncertainties and assumptions that are difficult to predict. Although we believe the expectations reflected in any forward-looking statements are based on reasonable assumptions, we can give no assurance that our expectations will be attained and therefore, actual outcomes and results may differ materially from what is expressed or forecasted in such forward-looking statements. Some of the factors that may affect outcomes and results include, but are not limited to: (i) national, international, regional and local economic climates, (ii) changes in financial markets, interest rates and foreign currency exchange rates, (iii) increased or unanticipated competition for our properties, (iv) risks associated with acquisitions, dispositions and development of properties, (v) maintenance of real estate investment trust (“REIT”) status and tax structuring, (vi) availability of financing and capital, the levels of debt that we maintain and our credit ratings, (vii) risks related to our investments in our co-investment ventures and funds, including our ability to establish new co-investment ventures and funds, (viii) risks of doing business internationally, including currency risks, (ix) environmental uncertainties, including risks of natural disasters, and (x) those additional factors discussed in reports filed with the Securities and Exchange Commission by Prologis under the heading “Risk Factors.” Prologis undertakes no duty to update any forward-looking statements appearing in this paper.
About Prologis
Prologis Inc. is the leading owner, operator and developer of industrial real estate, focused on global and regional markets across the Americas, Europe and Asia. As of June 30, 2012, Prologis owned or had investments in, on a consolidated basis or through unconsolidated joint ventures, properties and development projects totaling approximately 569 million square feet (52.9 million square meters) in 21 countries. The company leases modern distribution facilities to more than 4,500 customers, including manufacturers, retailers, transportation companies, third-party logistics providers and other enterprises.
About the Authors
Ali Nassiri is vice president, acquisitions & research for Prologis in Europe. He oversees Prologis’ research initiatives in Europe and sources/manages pan-European acquisitions and dispositions.
Ali holds a Masters in Business Administration (cum laude) and a Major in Supply Chain Management & Logistics (cum laude) from the Free (“Vrije”) University in Amsterdam and has a Bachelor’s degree in International Management from the Amsterdam Business School.
Dirk Sosef is director, research & strategy for Prologis in Europe. He is a member of the research and strategy team in Europe. Dirk holds a Bachelor in Real Estate Studies from the University of Applied Sciences (Fontys) in Eindhoven and is a member of the Royal Institute of Chartered Surveyors (RICS).
