Prologis U.S. Industrial Business Indicator™
Market fundamentals in the logistics real estate sector strengthened further in the fourth quarter of 2016. Market vacancies have fallen to record lows while demand continues to outpace supply. Net absorption closed out the year at 256 million square feet, the fourth consecutive year of demand above 250 million square feet, extending the cyclical high. 1 Our Industrial Business Indicator, the IBI, is a leading indicator of business decision-making and customer activity. Post-election, its reading has improved, reaching the strongest quarterly result in more than a year and calling for solid logistics real estate demand to continue in 2017. Healthy activity across all business segments reflected broader strengthening of business confidence, including retail, manufacturing, housing and automotive.2
The IBI is also establishing a track record as a leading indicator of the economy. Since the IBI’s inception in 2007, we have accumulated more than 100 months of data spanning nearly a decade. This data reveals a one- to three-month lead of economic activity. The IBI’s surge in Q4 2016 suggests an acceleration in economic activity and confirms improved sentiment in other macroeconomic indicators. The recent move in the IBI supports economist forecasts for better GDP growth in 2017 versus 2016, to 2.3 percent from 1.6 percent, according to Consensus Economics.
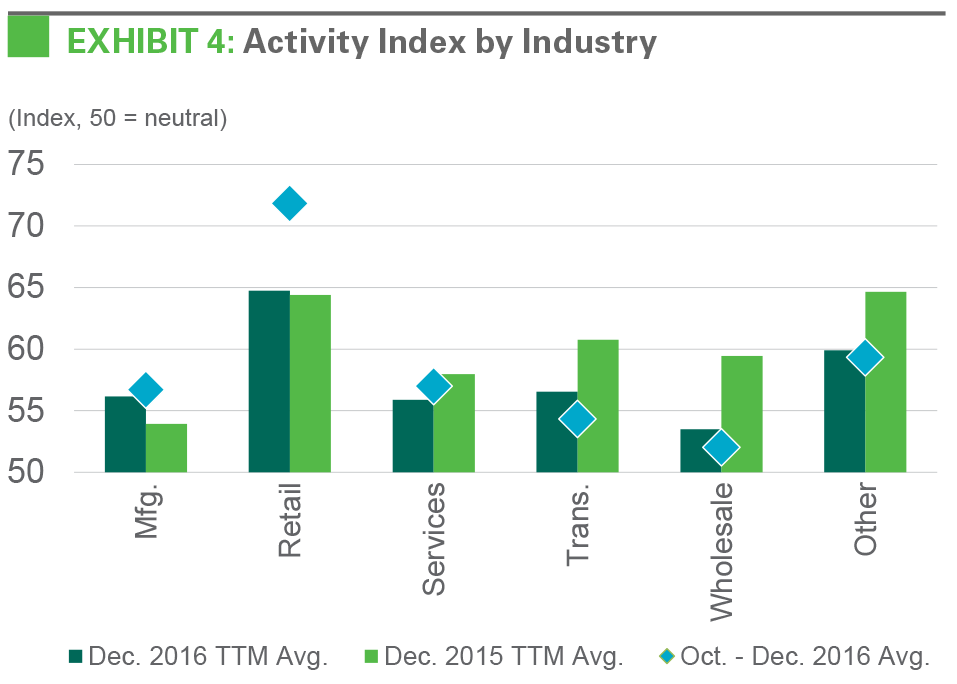
Customer activity ended 2016 on an upward trajectory. The IBI activity index closed out 2016 with the strongest quarterly reading since the third quarter of 2015, at 58.4. Readings at 50.0 are growth neutral (see Exhibit 1), while readings in the high 50s are consistent with normal growth. All constituent industries remain in expansion (as shown in Exhibit 4). Of note, manufacturers had heightened activity in 2016 versus 2015. The improvement in manufacturing from 53.9 to 56.2 illustrates the effect of firming industrial production observed in the broader economy.3 Retailers also improved in the December reading at 64.7, up from a low of 62.6 in September, reflecting a fourth quarter surge in consumer confidence, consumption, and retail sales.4 E-commerce is an overall positive for this segment, too.
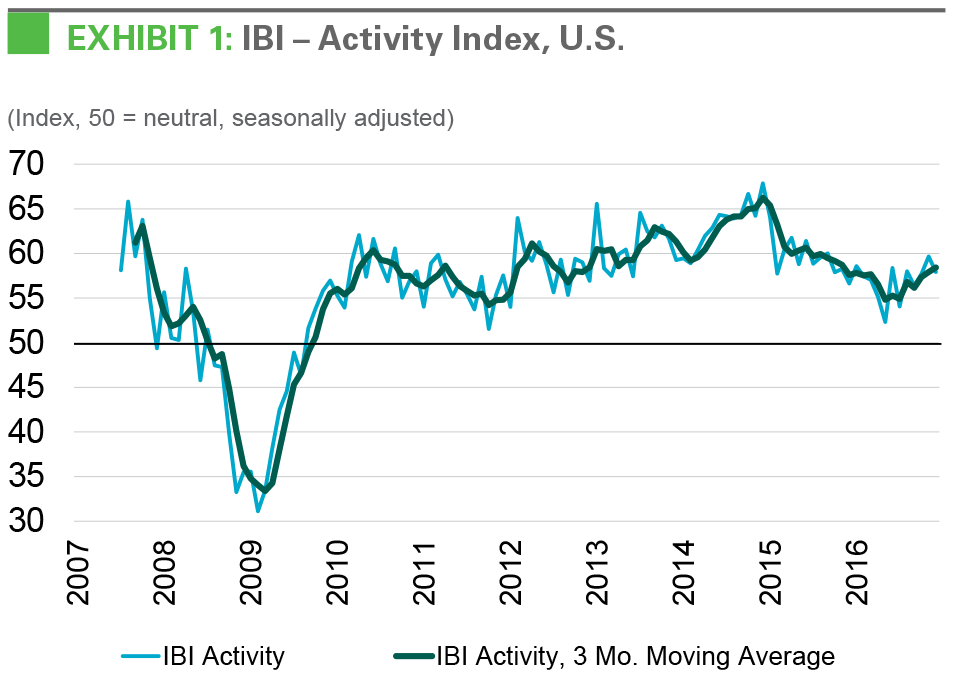
A strong IBI signals that U.S. economic activity is poised to accelerate. Our IBI is approaching its tenth anniversary and comprises more than 100 monthly surveys totaling more than 40,000 responses. Over time, it has established itself as a contemporary and leading indicator of economic activity. We find a correlation coefficient of 0.77 between GDP and our IBI activity index, with a lead of one to three months.5 Recent data reflect this correlation: in late 2015 and early 2016, the IBI activity index reversed from peak levels in mid-2015, which was ultimately borne out by slower GDP growth. More recently, the index’s recovery in late 2016 bodes well for GDP in the fourth quarter and, potentially, for the first part of 2017.6
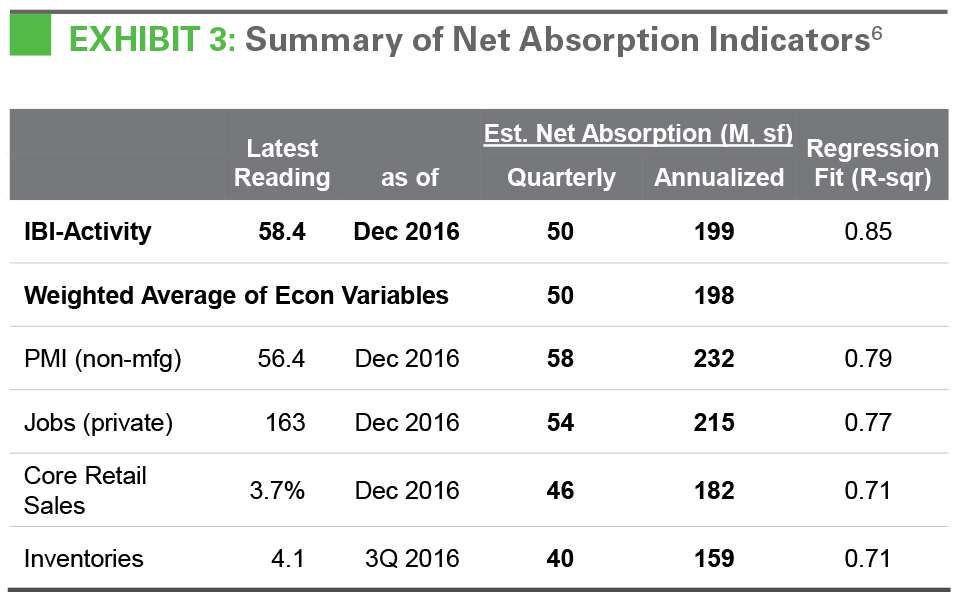
Note: The analysis above uses an auto regressive process. The auto regressive term for the fourth quarter was averaged with the term from the third quarter to account for period-to-period volatility. Without this smoothing, the quarterly estimate would have been 36 M sf, lower than 50M sf as shown in the table above.
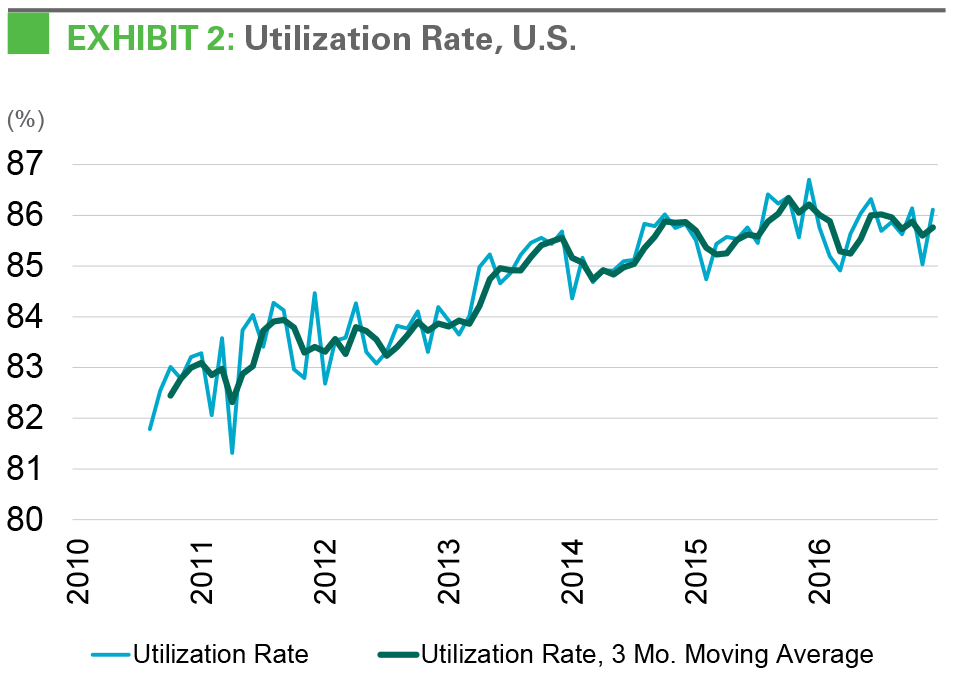
The historic peak in industry-wide utilization suggests customers must lease new space to accommodate their growing businesses. Utilization rates have been stable for the past two years, at 85.7%, which suggests full capacity in the warehousing sector. Customers as a result have been making the most of their existing facilities. At the same time, customer demand has been expanding. Consequentially, this growth is translating directly to new leasing as utilization rates reach a structural limit. This issue is particularly acute as market occupancies have reached all-time highs, at 95.1% according to data from CBRE. Together with space utilization, our data reveals overall utilization activity under roofs (utilization rate multiplied by occupancy rate) is 82%—the highest ever.
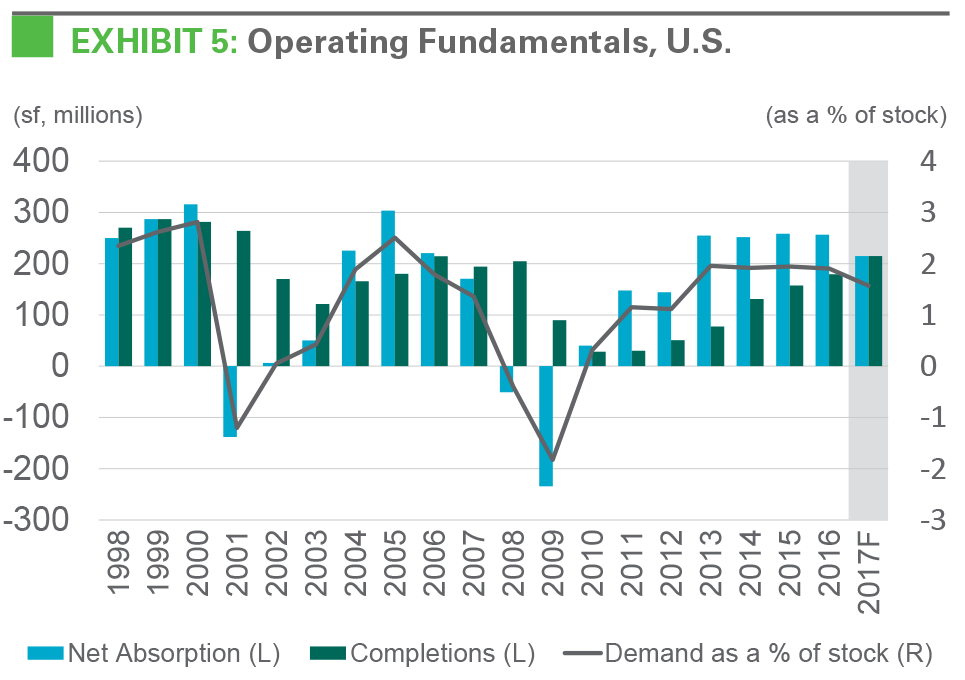
Strong demand for logistics facilities in 2016 marked the fourth year of solid growth. Net absorption was 47 million square feet in the fourth quarter and totaled 257 million square feet for all of 2016.7 On an annual basis, net absorption of logistics real estate has exceeded 250 million square feet since 2013, a trend that reflects an ongoing U.S. expansion.
The supply response for logistics real estate continues to lag. While completions have risen steadily since 2012, they have been slow to meet demand. In the fourth quarter of 2016, 45 million square feet of new supply was delivered.7 Still, deliveries totaled 179 million square feet in 2016 and fell far short of the 257 million square feet of net absorption in the same period. Structural factors that limit development, such as the availability of financing or the amount of developers across the U.S., continue. One cyclical factor that continues to matter is rising construction costs.
The macro backdrop for new demand has improved in recent months. Leading indicators have improved, signaling 200 million square feet of net absorption, and GDP growth is forecast to be higher in 2017 than in 2016 by Consensus Economics. As the cycle continues its expansion, consumption has become a major impetus for customers to lease space. Job growth has been steady within the 200,000 range for the past few years and wage growth has noticeably accelerated, underscoring the increasing spending power of U.S. consumers.8 The housing sector, whether new home construction, remodels or simply new household formation, continues to recover and has become one of the faster-growing industry types.9 In addition, the shift of consumption toward online sales has spurred demand for logistics real estate; online retailers use upward of three times as much space as traditional users (see our analysis). Last-mile delivery (consumers want to receive their purchases faster than ever) is pushing users to seek infill locations where supply is low and rents are rising quickly.
Prologis Research forecasts that historically low vacancy rates will persist throughout 2017. Steady leading indicators and an improving growth backdrop warrant a constructive view. For 2017, Prologis Research anticipates net absorption of 215 million square feet and 215 million square feet of completions, keeping vacancy at 4.9%. Additional growth drivers, such as the housing market and e-commerce, should provide upside potential to the demand forecast. In this environment, securing new quality space will remain a challenge, and customers with a thorough planning process and an ability to act have the best chance of securing the best space.
Endnotes
- CBRE-EA
- U.S. Bureau of Economic Analysis, U.S. Census Bureau, Institute for Supply Management
- Federal Reserve
- U.S. Census Bureau, The Conference Board
- U.S. Bureau of Economic Analysis.
- Based upon 15-year regression analyses, with data when available, using an auto-regressive process. IBI and PMI are the three-month moving average index levels. Jobs series is the three-month moving average change for private sector employment in thousands. Core retail sales (ex. autos and gasoline) are yr/yr growth in the three-month moving average. Private inventories change is quarterly in billions of 2009 dollars. The weighted average is based on R-squareds.
- CBRE-EA
- U.S. Bureau of Labor Statistics
- U.S. Census Bureau
Forward Looking Statements
This material should not be construed as an offer to sell or the solicitation of an offer to buy any security. We are not soliciting any action based on this material. It is for the general information of customers of Prologis.
This report is based, in part, on public information that we consider reliable, but we do not represent that it is accurate or complete, and it should not be relied on as such. No representation is given with respect to the accuracy or completeness of the information herein. Opinions expressed are our current opinions as of the date appearing on this report only. Prologis disclaims any and all liability relating to this report, including, without limitation, any express or implied representations or warranties for statements or errors contained in, or omissions from, this report.
Any estimates, projections or predictions given in this report are intended to be forward-looking statements. Although we believe that the expectations in such forward-looking statements are reasonable, we can give no assurance that any forward-looking statements will prove to be correct. Such estimates are subject to actual known and unknown risks, uncertainties and other factors that could cause actual results to differ materially from those projected. These forward-looking statements speak only as of the date of this report. We expressly disclaim any obligation or undertaking to update or revise any forward-looking statement contained herein to reflect any change in our expectations or any change in circumstances upon which such statement is based.
No part of this material may be (i) copied, photocopied, or duplicated in any form by any means or (ii) redistributed without the prior written consent of Prologis.
Prologis Research
Prologis’ research department studies fundamental and investment trends and Prologis’ customers’ needs to assist in identifying opportunities and avoiding risk across four continents. The team contributes to investment decisions and long-term strategic initiatives, in addition to publishing white papers and other research reports. Prologis publishes research on the market dynamics impacting Prologis’ customers’ businesses, including global supply chain issues and developments in the logistics and real estate industries. Prologis’ dedicated research team works collaboratively with all company departments to help guide Prologis’ market entry, expansion, acquisition and development strategies.
About Prologis
Prologis, Inc., is the global leader in logistics real estate with a focus on high-barrier, high-growth markets. As of December 31, 2016, the company owned or had investments in, on a wholly owned basis or through co-investment ventures, properties and development projects expected to total approximately 676 million square feet (63 million square meters) in 20 countries. Prologis leases modern logistics facilities to a diverse base of approximately 5,200 customers across two major categories: business-to- business and retail/online fulfillment.
