Prologis’ Industrial Business Indicator (IBI), the company’s proprietary survey of customer activity levels and facility utilization rates, reveals the logistics market is entering a new phase of acceleration. Our customers reported record levels of activity in July and note that their utilization of existing space remains above average. We anticipate net absorption of 215-220M sf and 110M sf of completions in 2014. We expect this favorable supply/demand imbalance will push vacancy to near-15-year lows.
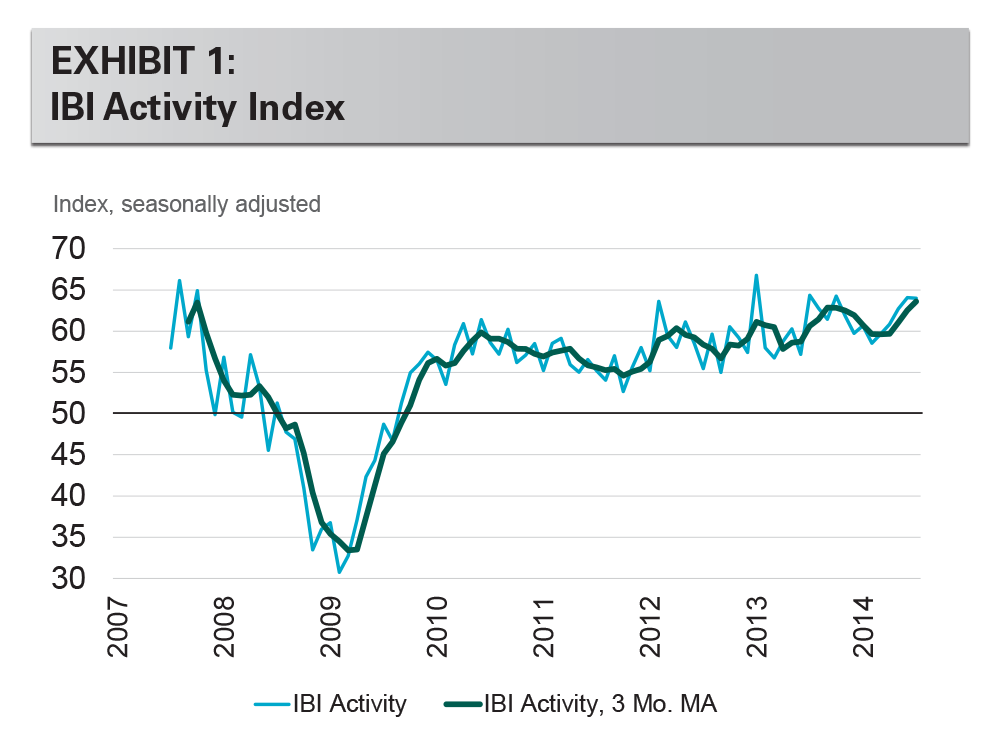
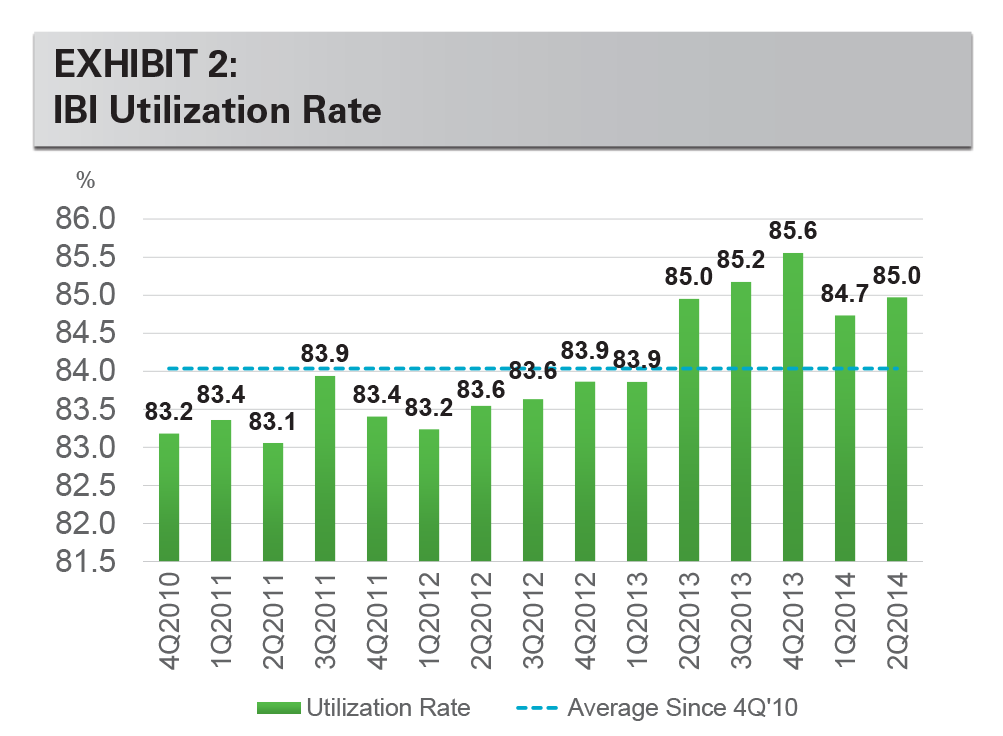
IBI results indicate that our customers carried strong momentum into the third quarter. The activity index began a strong upward trend in the wake of the frigid winter earlier this year, which continued into the summer. After adjusting for seasonality, the index was 64.0 in July, and the three-month moving average rose to a new record of 63.6. The IBI is a diffusion index, where results above 50 indicate expansion. Our surveys also study facility utilization level, which reveals that our customers’ spaces are being kept full. This combination of record business growth and low levels of unused space suggests that business expansion requires new demand for logistics space.
Analyzing the IBI activity index by geography, all regions continue to enjoy strength. Results in the May-July period were led by growth in the Western markets, while the Central and East regions were healthy but stable. In addition, infill markets with a high concentration of small-space users are performing very well, with above-average IBI results in New York / New Jersey and San Francisco. The Texas markets are also very strong, including both Houston and Dallas. Also notable is Atlanta, where results have climbed above the national average in the past year. Those markets that are below the index average, although still above 50, include Chicago and a handful of smaller regional markets.
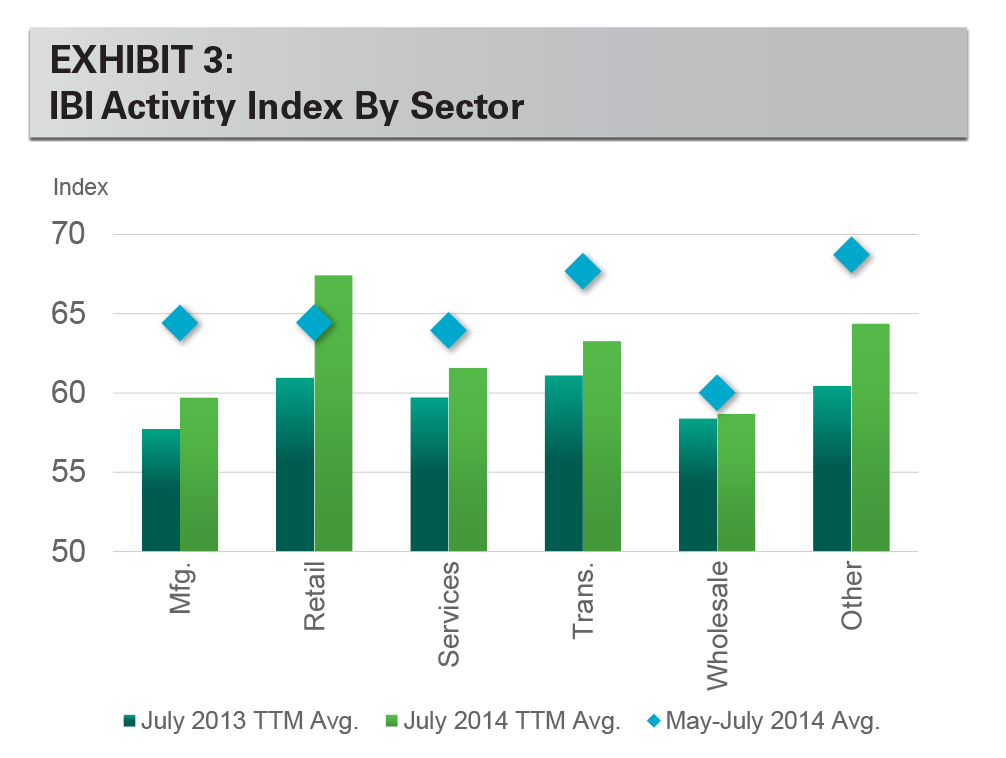
The IBI momentum is broad-based among customer industries. Activity levels have increased across all industries in the past year, led by retailers. On a short-term basis, customers in the transportation industry reported the strongest activity in the May-July period. This category includes third-party logistics providers, a large segment that, in turn, represents clients in a variety of industries. The health of the transportation sector, and third-party logistics providers in particular, is a good sign for diversified growth of logistics.
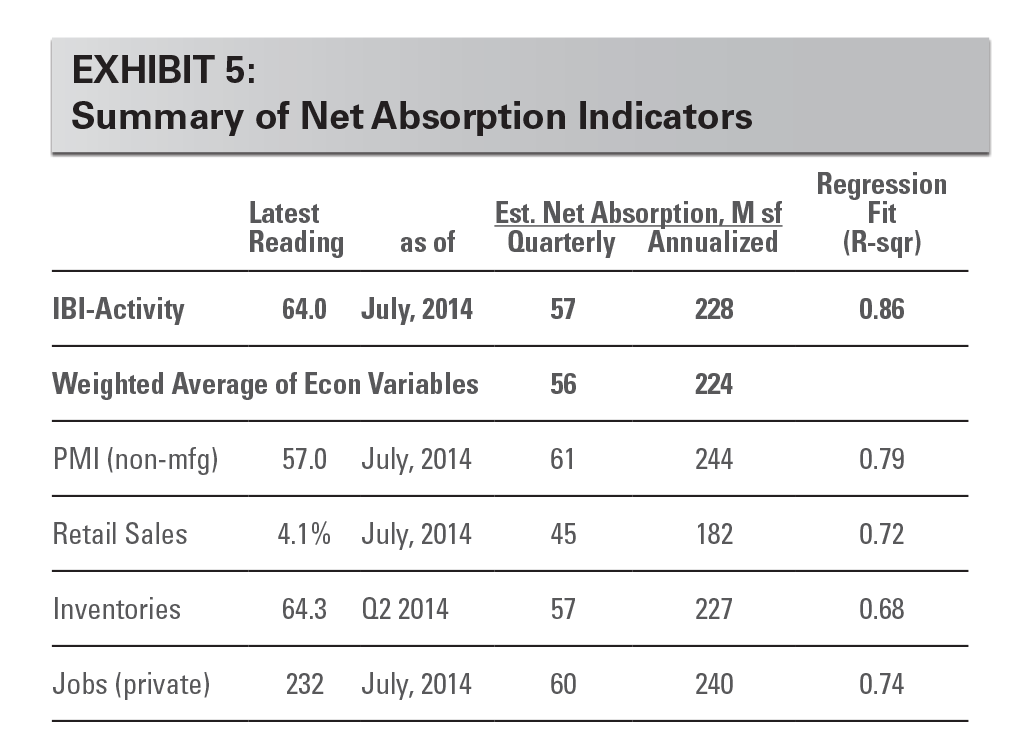
The U.S. economy is hitting a new stride, giving a positive impulse to logistics demand. Incoming data in the spring and summer months have put to rest questions about the health of the economic expansion that arose following weather-induced weakness early in the year. Looking ahead, the leading indicators of logistics demand continue to be bright, showing few signs of a summer activity slowdown. Exhibit 5 highlights key leading indicators and implied net absorption based upon our regression analyses. Inventory accumulation began to accelerate in the second half of 2013, amid continued economic growth and greater clarity in its direction. Inventory levels increased another $129B annualized in the first half of this year and are now $200B above prior peak level. Notably, the labor market has become a tail wind to consumers. Job growth has exceeded 200K per month since February, the first six-month string of +200K gains since 1997.
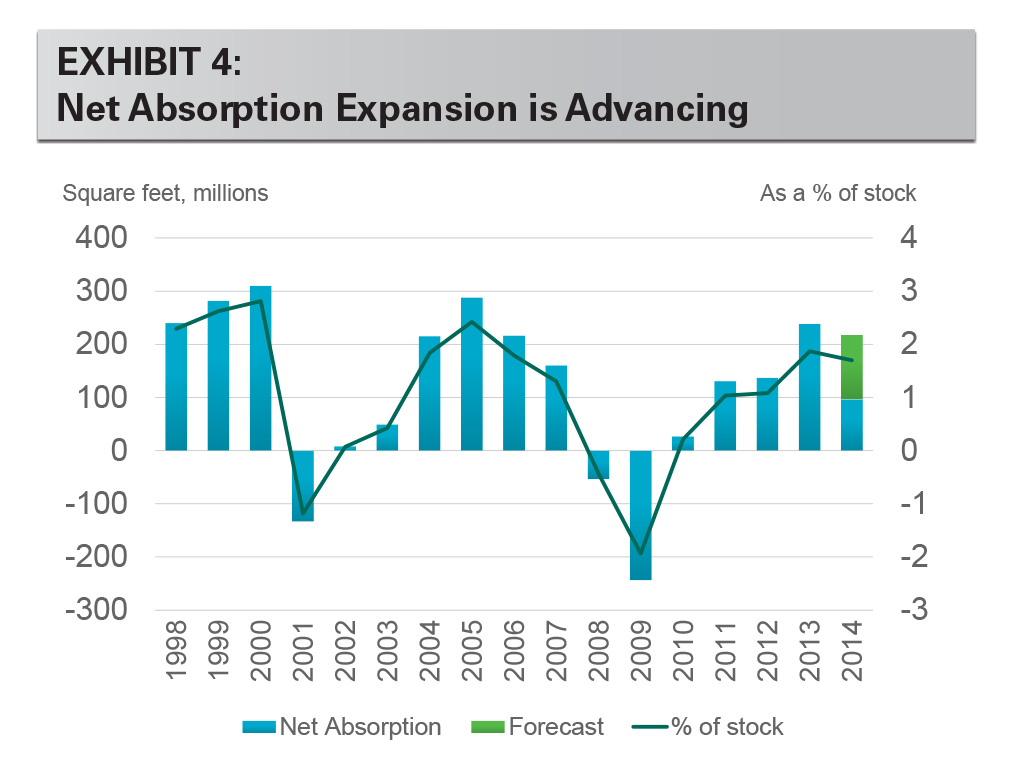
We expect strong demand for full-year 2014. Net absorption of 53M sf (0.4% of stock) in the second quarter brings the total for the first half of the year to 97M sf (0.8%), according to CBRE-EA, which we annualize to 205M sf based on seasonality. Our full-year forecast of 215-220M sf for 2014 is based on a moderately higher pace during the second half of the year, which is consistent with our leading indicators of demand.
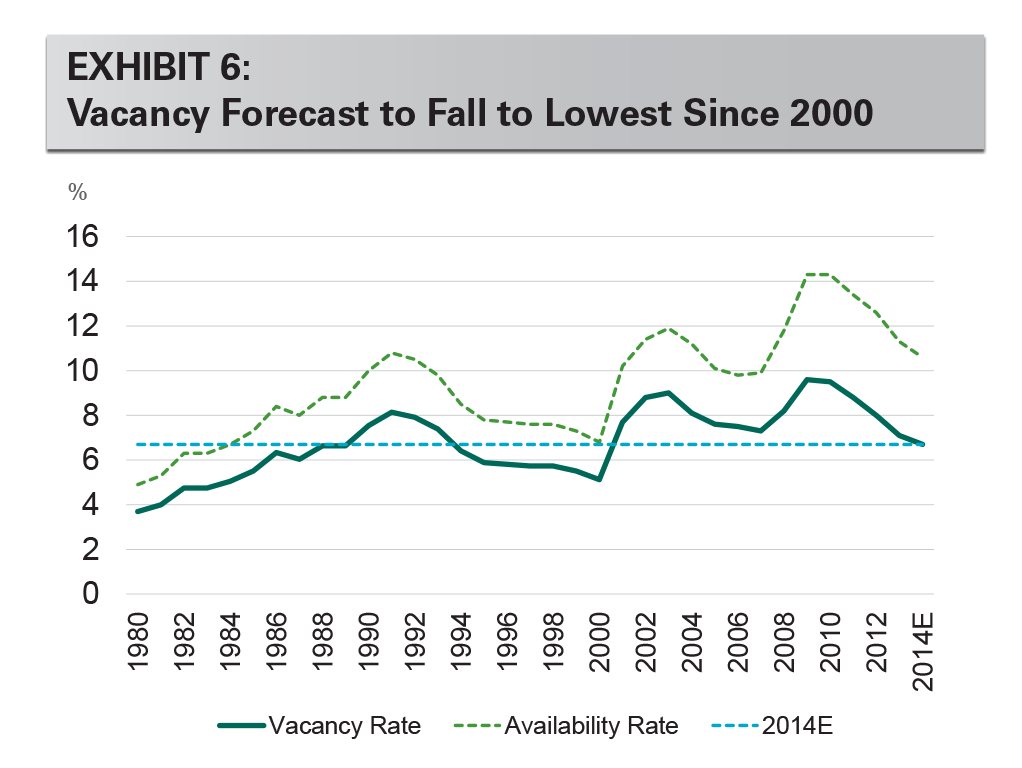
The pace of net absorption continues to outstrip supply, and we expect vacancy declines to continue. Completions in the first half of the year were 50M sf (0.4% of stock), according to CBRE-EA. We expect approximately 110M sf (0.9%) in total this year, half the pace of net absorption. An excess demand gap persists in key markets but is narrowing as strong rent growth and cap rate compression make more development feasible. However, growing construction costs are a limiting factor. Even in the most active development markets, conditions today are approaching balance rather than oversupply. Nationally, vacancy fell to just 6.9% in the second quarter, according to CBRE-EA, the lowest level since 2001. Our forecast implies that vacancy will continue to decline through the rest of the year to reach the lowest since 2000.
CONCLUSION
The U.S. economy is again a tail wind to logistics demand. The Prologis IBI survey, along with other leading indicators of demand, points to the ongoing expansion in the logistics market. Demand continues to outstrip supply nationally. We expect this trend of rising occupancy to continue as the logistics market has a strong finish to 2014 and builds positive momentum for 2015.
Forward-Looking Statements
This material should not be construed as an offer to sell or the solicitation of an offer to buy any security. We are not soliciting any action based on this material. It is for the general information of customers of Prologis.
This report is based, in part, on public information that we consider reliable, but we do not represent that it is accurate or complete, and it should not be relied on as such. No representation is given with respect to the accuracy or completeness of the information herein. Opinions expressed are our current opinions as of the date appearing on this report only. Prologis disclaims any and all liability relating to this report, including, without limitation, any express or implied representations or warranties for statements or errors contained in, or omissions from, this report.
Any estimates, projections or predictions given in this report are intended to be forward-looking statements. Although we believe that the expectations in such forward-looking statements are reasonable, we can give no assurance that any forward-looking statements will prove to be correct. Such estimates are subject to actual known and unknown risks, uncertainties and other factors that could cause actual results to differ materially from those projected. These forward-looking statements speak only as of the date of this report. We expressly disclaim any obligation or undertaking to update or revise any forward-looking statement contained herein to reflect any change in our expectations or any change in circumstances upon which such statement is based.
No part of this material may be copied, photocopied, or duplicated in any form by any means or redistributed without the prior written consent of Prologis.
Prologis Research
Prologis’ research department studies fundamental and investment trends and Prologis’ customers’ needs to assist in identifying opportunities and avoiding risk across four continents. The team contributes to investment decisions and long-term strategic initiatives, in addition to publishing white papers and other research reports. Prologis publishes research on the market dynamics impacting Prologis’ customers’ businesses, including global supply chain issues and developments in the logistics and real estate industries. Prologis’ dedicated research team works collaboratively with all company departments to help guide Prologis’ market entry, expansion, acquisition and development strategies.
About Prologis
Prologis, Inc., is the leading owner, operator and developer of industrial real estate, focused on global and regional markets across the Americas, Europe and Asia. As of June 30, 2014, Prologis owned or had investments in, on a consolidated basis or through unconsolidated joint ventures, properties and development projects totaling approximately 571 million square feet (53 million square meters) in 21 countries. The company leases modern distribution facilities to more than 4,700 customers, including manufacturers, retailers, transportation companies, third-party logistics providers and other enterprises.
Copyright © 2014 Prologis, Inc. All rights reserved.
